Difference between revisions of "Category: PQplot"
(→Correlations) |
|||
| Line 98: | Line 98: | ||
</td></tr> | </td></tr> | ||
<tr><td> | <tr><td> | ||
| − | Gas well | + | Gas well [IPR]] – pseudo-pressure equation using Jd and kh values |
</td><td> | </td><td> | ||
Real-gas pseudopressure equation | Real-gas pseudopressure equation | ||
| Line 140: | Line 140: | ||
[[Category:pengtools]] | [[Category:pengtools]] | ||
| + | |||
| + | {{#seo: | ||
| + | |title=Nodal analysis software | ||
| + | |titlemode= replace | ||
| + | |keywords=nodal analysis, tubing, reservoir, fluids flow, sensitivity, liquid loading, petroleum engineering | ||
| + | |description=PQplot calculates inflow performance relationship and vertical lift performance curves for oil and gas wells for nodal analysis. | ||
| + | }} | ||
Revision as of 10:52, 1 November 2018
Brief
PQplot is the core petroleum engineering engine of the pengtools.
PQplot calculates inflow performance relationship IPR and vertical lift performance VLP curves for oil and gas wells.
PQplot is available online at www.pengtools.com and in AppStore for iPad.
Typical applications
- Calculating the Nodal Analysis [1] model of the well
- Matching the Nodal Analysis model to the well test data
- Calculating and exporting the VLP tables to Excel or reservoir simulator
- Estimation of well's Production Potential and absolute open flow (AOF)
- Tubing sizing
- Selection of the operating wellhead pressures
- Estimation of the effects of reservoir pressure depletion
- Sensitivity studies
Main features
- Multiphase flow correlations
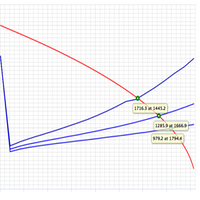
- Plot of Inflow performance curve IPR and Vertical lift performance curve VLP
- Rate and pressure at intersection point
- Tubing, annular and tubing+annular flow types
- "Default values" button resets input values to the default values
- Switch between Metric and Field units
- Save/load models to the files and to the user’s cloud
- Share models to the public cloud or by using model’s link
- Export pdf report containing input parameters, calculated values and plots of the PQplot
- Continue your work from where you stopped: last saved model will be automatically opened
- Download the chart as an image or data and print (upper-right corner chart’s button)
- Export results table to Excel or other application
Demo
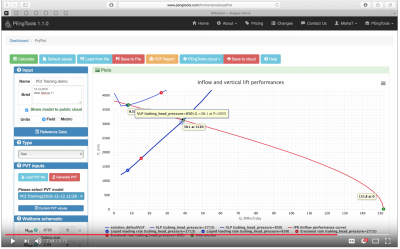
The demo is a copy of a training seminar. This video demonstrates basic functionality of the PVT Tool and PQplot tools. It is shown how to create the well nodal analysis model, run sensitivity, save the model.
In this demo we are solving the homework where it was asked to:
- Calculate the flowing bottomhole pressure.
- Construct VLP curve
- Construct IPR and calculate AOF
- Calculate current production efficiency (production/AOF)
- What is the production potential and what actions do you propose to close the performance gap?
- What will be production increment from the proposed actions?
PVT model at www.pengtools.com
PQplot model at www.pengtools.com
Correlations
| Type of problem | Correlation | Reference |
|---|---|---|
|
Oil well VLP |
Hagedorn, A. R., & Brown, K. E. (1965). Experimental study of pressure gradients occurring during continuous two-phase flow in small-diameter vertical conduits. Journal of Petroleum Technology, 17(04), 475-484. | |
|
Gas well VLP |
Gray, H. E. (1974). Vertical flow correlation in gas wells. User manual for API14B, subsurface controlled safety valve sizing computer program. | |
|
Dry gas VLP |
Cullender, M.H. and Smith, R.V. 1956. Practical Solution of Gas-Flow Equations for Wells and Pipelines with Large Temperature Gradients. Trans., AIME 207: 281. | |
|
Oil well IPR |
Composite IPR based – Vogel equations taking into account water |
Kermit E. Brown "The Technology of Artificial Lift Methods" Vol. 4 Production Optimization of Oil and Gas Wells by Nodal System Analysis, p. 30, section 2.227.1 |
|
Gas well IPR – backpressure equation |
Rawlins and Schellhardt |
Rawlins, E.L. and Schellhardt, M.A. 1935. Backpressure Data on Natural Gas Wells and Their Application to Production Practices, Vol. 7. Monograph Series, USBM. |
|
Gas well [IPR]] – pseudo-pressure equation using Jd and kh values |
Real-gas pseudopressure equation |
See for example: Ahmed, T., & McKinney, P. (2011). Advanced reservoir engineering. Gulf Professional Publishing. |
|
Turner |
Turner, R. G., Hubbard, M. G., and Dukler, A. E. (1969) “Analysis and Prediction of Minimum Flow Rate for the Continuous Removal of Liquids from Gas Wells,” Journal of Petroleum Technology, Nov. 1969. pp. 1475–1482. | |
|
Guidelines from API RP14E |
Mokhatab S, Poe WA, Speight JG (2006) "Handbook of Natural Gas Transmission and Processing", Section 11.6 - Design Considerations on sales gas pipelines, subsection 11.6.1 - Line Sizing Criteria, Elsevier, 2006. |
PVT correlations are the same as in PVT tool.
References
- ↑ Mach, Joe; Proano, Eduardo; E. Brown, Kermit (1979). "A Nodal Approach For Applying Systems Analysis To The Flowing And Artificial Lift Oil Or Gas Well"
 (SPE-8025-MS). Society of Petroleum Engineers.
Pages in category "PQplot"
The following 13 pages are in this category, out of 13 total.


