Difference between revisions of "Petroleum Engineering Timeline"
From wiki.pengtools.com
(→Brief) |
|||
| (12 intermediate revisions by the same user not shown) | |||
| Line 1: | Line 1: | ||
__TOC__ | __TOC__ | ||
| − | == | + | == Petroleum Engineering Timeline == |
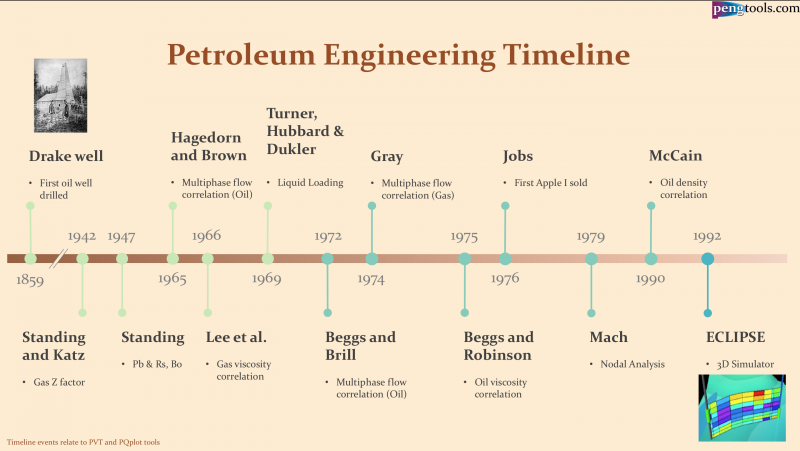
[[Petroleum Engineering Timeline]] is a timeline which describes the evolution of the Petroleum Engineering Science over time. | [[Petroleum Engineering Timeline]] is a timeline which describes the evolution of the Petroleum Engineering Science over time. | ||
| − | From the first well drilled, first PVT correlation, first multiphase flow correlation, through the first computer to the modern reservoir simulator. | + | From the first well drilled, first PVT correlation, first multiphase flow correlation, through the first computer to the modern reservoir 3D simulator. |
| − | [[File:Petroleum Engineering Timeline.png|left|thumb|800px|Petroleum Engineering Timeline]] | + | [[File:Petroleum Engineering Timeline.png|left|thumb|800px|Petroleum Engineering Timeline]] |
| − | + | ||
| + | ==Timeline== | ||
<table width="100%" border="1" cellpadding="3" cellspacing="1"> | <table width="100%" border="1" cellpadding="3" cellspacing="1"> | ||
| Line 38: | Line 39: | ||
<td>1965</td> | <td>1965</td> | ||
<td>Hagedorn and Brown</td> | <td>Hagedorn and Brown</td> | ||
| − | <td>[[Hagedorn and Brown]] Multiphase flow correlation is a default [[PQplot]] oil [[VLP]] correlation</td> | + | <td>[[Hagedorn and Brown correlation|Hagedorn and Brown]] Multiphase flow correlation is a default [[PQplot]] oil [[VLP]] correlation</td> |
</tr> | </tr> | ||
| Line 80: | Line 81: | ||
<td>1979</td> | <td>1979</td> | ||
<td>Mach</td> | <td>Mach</td> | ||
| − | <td>Nodal Analysis is implemented in the [[PQplot]]</td> | + | <td>[[Well Nodal Analysis]] is implemented in the [[PQplot]]</td> |
</tr> | </tr> | ||
| Line 96: | Line 97: | ||
</table> | </table> | ||
| − | |||
[[Category:pengtools]] | [[Category:pengtools]] | ||
[[Category:Technology]] | [[Category:Technology]] | ||
| + | |||
| + | {{#seo: | ||
| + | |title=Petroleum Engineering Timeline | ||
| + | |titlemode= replace | ||
| + | |keywords=Petroleum Engineering Timeline | ||
| + | |description=Petroleum Engineering Timeline is a timeline which describes the evolution of the Petroleum Engineering Science over time. | ||
| + | }} | ||
Latest revision as of 07:40, 31 May 2020
Petroleum Engineering Timeline
Petroleum Engineering Timeline is a timeline which describes the evolution of the Petroleum Engineering Science over time.
From the first well drilled, first PVT correlation, first multiphase flow correlation, through the first computer to the modern reservoir 3D simulator.
Timeline
| Year | Author | Note |
|---|---|---|
| 1859 | Drake well | First oil well drilled. https://en.wikipedia.org/wiki/Drake_Well |
| 1942 | Standing and Katz | Dranchuk correlation for the Standing and Katz Gas Z factor is a default PVT tool correlation |
| 1947 | Standing | Pb & Rs, Bo |
| 1965 | Hagedorn and Brown | Hagedorn and Brown Multiphase flow correlation is a default PQplot oil VLP correlation |
| 1966 | Lee et al. | Lee Gas viscosity correlation is a default PVT tool correlation |
| 1969 | Turner, Hubbard & Dukler | Liquid loading is a default PQplot liquid loading equation |
| 1972 | Beggs and Brill | Beggs and Brill Multiphase flow correlation is a default sPipe oil & gas correlation |
| 1974 | Gray | Gray Multiphase flow correlation is a default PQplot gas VLP correlation |
| 1975 | Beggs and Robinson | Beggs and Robinson Oil viscosity correlation is a default PVT tool correlation |
| 1976 | Jobs | First Apple I sold. https://en.wikipedia.org/wiki/Apple_I |
| 1979 | Mach | Well Nodal Analysis is implemented in the PQplot |
| 1990 | McCain | McCain Oil density correlation is a default PVT tool correlation |
| 1992 | ECLIPSE | 3D Simulator. https://en.wikipedia.org/wiki/ECLIPSE_(reservoir_simulator) |

