Difference between revisions of "Category: PQplot"
From wiki.pengtools.com
| Line 7: | Line 7: | ||
Featuring multiphase flow correlations and sensitivity analysis. It features a simple and easy to use input screen and generates a robust output that can be saved and shared. | Featuring multiphase flow correlations and sensitivity analysis. It features a simple and easy to use input screen and generates a robust output that can be saved and shared. | ||
| − | + | [http://www.pengtools.com/pqPlot PQplot] at pengtools.com. | |
PQplot also available for your [https://itunes.apple.com/us/app/pqplot/id1076170307 iPAD on Apple AppStore] | PQplot also available for your [https://itunes.apple.com/us/app/pqplot/id1076170307 iPAD on Apple AppStore] | ||
[[Category:pengtools]] | [[Category:pengtools]] | ||
Revision as of 11:54, 7 April 2017
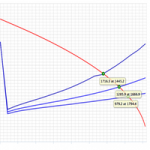
PQplot tool is at the heart of Petroleum Engineering.
It calculates inflow performance relationship (IPR) and vertical lift performance (VLP) curves for oil and gas wells.
Featuring multiphase flow correlations and sensitivity analysis. It features a simple and easy to use input screen and generates a robust output that can be saved and shared.
PQplot at pengtools.com.
PQplot also available for your iPAD on Apple AppStore
Pages in category "PQplot"
The following 13 pages are in this category, out of 13 total.