Difference between revisions of "VLP"
| (9 intermediate revisions by the same user not shown) | |||
| Line 1: | Line 1: | ||
__TOC__ | __TOC__ | ||
| + | <div style='text-align: right;'>By Mikhail Tuzovskiy on {{REVISIONTIMESTAMP}}</div> | ||
==Vertical Lift Performance== | ==Vertical Lift Performance== | ||
| Line 8: | Line 9: | ||
[[VLP]] curve shows how much pressure required to lift a certain amount of fluid to the surface at the given well head pressure. | [[VLP]] curve shows how much pressure required to lift a certain amount of fluid to the surface at the given well head pressure. | ||
| − | [[VLP]] curve is used in Nodal Analysis [[:Category:PQplot|PQplot]] software for production systems design, analysis and optimization. | + | [[VLP]] curve is used in [[Well Nodal Analysis]] [[:Category:PQplot|PQplot]] software for production systems design, analysis and optimization. |
==Math and Physics== | ==Math and Physics== | ||
| Line 35: | Line 36: | ||
===Oil well VLP correlation=== | ===Oil well VLP correlation=== | ||
[[Hagedorn and Brown correlation|Hagedorn and Brown]] is the default [[VLP]] correlation for the '''oil wells''' in the [[:Category:PQplot|PQplot]]. | [[Hagedorn and Brown correlation|Hagedorn and Brown]] is the default [[VLP]] correlation for the '''oil wells''' in the [[:Category:PQplot|PQplot]]. | ||
| + | |||
| + | ==== VLP Demo Video==== | ||
| + | |||
| + | [[File:Hagedorn and Brown demo.png|400px|https://www.youtube.com/watch?v=DpSv3kWPsIk | Watch on youtube]] | ||
| + | |||
| + | [[Media:Hagedorn and Brown ppt.pdf|Download presentation (pdf)]] | ||
| + | |||
| + | In this video it's shown: | ||
| + | *What the Hagedorn and Brown correlation is | ||
| + | *History and practical application | ||
| + | *Math & Physics | ||
| + | *Flow diagram to get the VLP curve | ||
| + | *Workflow to find HL | ||
===Gas well VLP correlation=== | ===Gas well VLP correlation=== | ||
| − | [[Gray correlation|Gray]] is the default [[VLP]] correlation for the '''gas wells''' in the [[PQplot]]. | + | [[Fanning correlation]] is the default [[VLP]] correlation for the dry gas wells in the [[:Category:PQplot|PQplot]] . |
| + | |||
| + | [[Gray correlation|Gray]] is the default [[VLP]] correlation for the '''gas wells''' in the [[:Category:PQplot|PQplot]]. | ||
==VLP calculator software== | ==VLP calculator software== | ||
*[[:Category:PQplot | PQplot]] nodal analysis software is used to calculate the [[VLP]] curves. [[:Category:PQplot | PQplot]] is available online at [https://www.pengtools.com www.pengtools.com]. | *[[:Category:PQplot | PQplot]] nodal analysis software is used to calculate the [[VLP]] curves. [[:Category:PQplot | PQplot]] is available online at [https://www.pengtools.com www.pengtools.com]. | ||
| + | *Prosper | ||
| + | *Perform | ||
| + | *Kappa | ||
| + | *IHS / Fekete | ||
*Excel | *Excel | ||
*other | *other | ||
Latest revision as of 05:29, 3 January 2023
Contents
Vertical Lift Performance
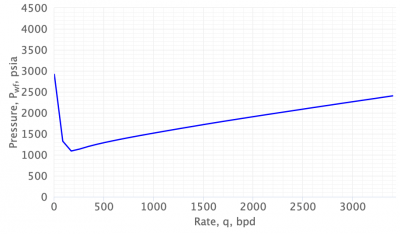
Vertical Lift Performance curve is a relationship between the flow rate and the pressure.
VLP curve shows how much pressure required to lift a certain amount of fluid to the surface at the given well head pressure.
VLP curve is used in Well Nodal Analysis PQplot software for production systems design, analysis and optimization.
Math and Physics

This is a wellbore schematic. We have the reservoir, perforations, bottomhole, completion string and the wellhead.
The depth of the well is h. The two pressure points of importance are flowing bottom hole pressure FBHP and flowing well head pressure FWHP.
To build the VLP curve we need to calculate the bottom hole pressure given the well head pressure for the different well rates in a range form 0 to AOF.
To do it we need to solve the Energy balance equation.
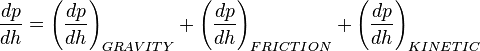
This equation relates the pressure to the distance for the given mass.
It has 3 terms: Gravity, Friction and Kinetic.
To find the required lift pressure we need to integrate this equation over the fluid’s travel distance.
All available VLP correlations are solving the same equation.
The differences are usually in the way how the friction term is calculated.
Oil well VLP correlation
Hagedorn and Brown is the default VLP correlation for the oil wells in the PQplot.
VLP Demo Video

In this video it's shown:
- What the Hagedorn and Brown correlation is
- History and practical application
- Math & Physics
- Flow diagram to get the VLP curve
- Workflow to find HL
Gas well VLP correlation
Fanning correlation is the default VLP correlation for the dry gas wells in the PQplot .
Gray is the default VLP correlation for the gas wells in the PQplot.
VLP calculator software
- PQplot nodal analysis software is used to calculate the VLP curves. PQplot is available online at www.pengtools.com.
- Prosper
- Perform
- Kappa
- IHS / Fekete
- Excel
- other