Difference between revisions of "Category: Mature Water Flood Analysis"
(→Data Required) |
|||
| (22 intermediate revisions by the same user not shown) | |||
| Line 4: | Line 4: | ||
[[Mature Water Flood Analysis]] is a workflow for identifying the performance gaps in the mature waterfloods performance. | [[Mature Water Flood Analysis]] is a workflow for identifying the performance gaps in the mature waterfloods performance. | ||
| − | [[Mature Water Flood Analysis]] is applied to the [[Reservoirs]] and uses [[Monthly Measures]] for production/injection data. | + | [[Mature Water Flood Analysis]] is applied to the [[Reservoirs]] and uses [[Daily Measures]]/[[Monthly Measures]] for production/injection data. |
[[File:MWFA.png|800px|MWFA]] | [[File:MWFA.png|800px|MWFA]] | ||
| Line 11: | Line 11: | ||
[[File:EnhancementListBlocks.png|800px|Block Enhancement List]] | [[File:EnhancementListBlocks.png|800px|Block Enhancement List]] | ||
| + | |||
| + | ==The goal of the waterflooding== | ||
| + | |||
| + | The goal of the water flooding is to inject the least possible water to produce the most possible oil in the shortest possible time. | ||
==Workflow== | ==Workflow== | ||
#Upload the required data | #Upload the required data | ||
| − | #Gridding - Divide the field into | + | #Gridding - Divide the field into [[Block]]s/[[Pattern]]s using the [[Bubble map]] by identifying dominant no-flow boundaries. '''No-flow boundary''' is a line in the reservoir where reservoir fluids do not cross. Oil and water on either side of the line flow away from this line. |
| − | #Calculate | + | #Calculate the well allocation factors [[WAF]] for blocks/patterns. |
| − | #Match STOIIP | + | #Calculate each block/pattern cumulative fluids production and injection volumes. Number of active producers and injectors. Current and total well stock. |
| − | #Make Plots (by field, by reservoir, by block):History, RF vs HCPVinj, RF vs well spacing, [[WOR vs Np]], VRR vs t | + | #Calculate [[HCPV]] from the blocks/patterns areas and [[Well Log Interpretation]] summaries |
| + | #Match total [[HCPV]] to the [[STOIIP]] numbers by changing the edge [[Block]]s areas | ||
| + | #Calculate waterflood performance indicators: [[HCPVinj]], RF, [[VRR]], VRRcum | ||
| + | #Make Plots (by field, by reservoir, by block): History, RF vs HCPVinj, RF vs well spacing, [[WOR vs Np]], VRR vs t | ||
#Make Maps (by reservoir) showing Blocks: HCPV, HCPVinj, RF, VRR | #Make Maps (by reservoir) showing Blocks: HCPV, HCPVinj, RF, VRR | ||
#Make Cross sections | #Make Cross sections | ||
| Line 29: | Line 36: | ||
=== Data Required=== | === Data Required=== | ||
*Create [[Field]]s | *Create [[Field]]s | ||
| − | * | + | * Create/upload [[Reservoirs]] |
*Upload [[PVT]] | *Upload [[PVT]] | ||
*[[Upload Wells]] | *[[Upload Wells]] | ||
| + | *Upload [[Monthly Measures]] | ||
*Upload [[Deviation Survey]]s | *Upload [[Deviation Survey]]s | ||
| − | + | *Upload [[Well Log Interpretation]]s (Note that at the moment for HCPV calculations EP Portal averages data across the uploaded versions. It is recommended to use 1 version of the well log interpretation for MWFA) | |
| − | *Upload [[Well Log Interpretation]]s | ||
| − | |||
=== Action List === | === Action List === | ||
The typical actions are: | The typical actions are: | ||
*Convert producing well to injector | *Convert producing well to injector | ||
| − | *Shut in inefficient injection well | + | *Shut in inefficient injection well, water-cyclers |
*Increase/Decrease well injection rate | *Increase/Decrease well injection rate | ||
*Add/squeeze [[Perforations]] at producing or injection wells | *Add/squeeze [[Perforations]] at producing or injection wells | ||
Latest revision as of 09:00, 1 August 2022
Contents
Brief
Mature Water Flood Analysis is a workflow for identifying the performance gaps in the mature waterfloods performance.
Mature Water Flood Analysis is applied to the Reservoirs and uses Daily Measures/Monthly Measures for production/injection data.
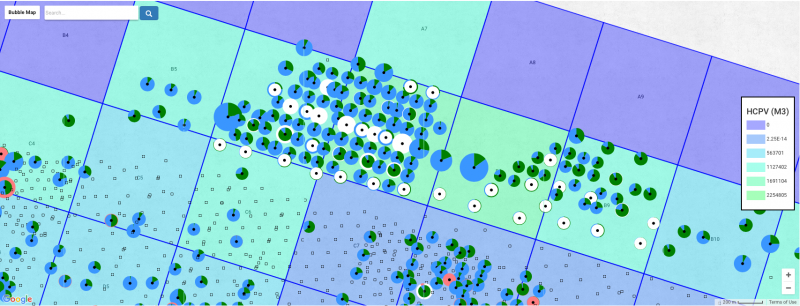
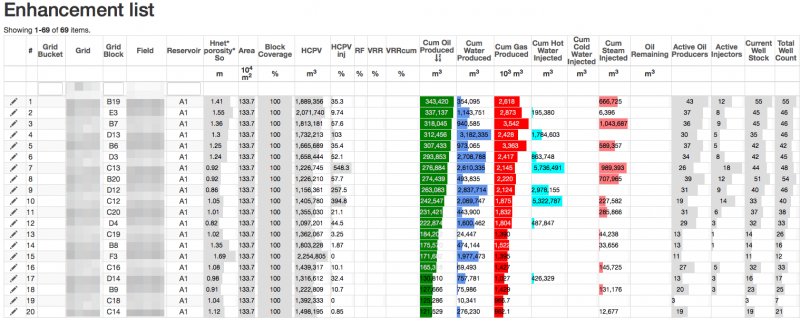
As a result Mature Water Flood Analysis generates Blocks/Patterns Enhancement List.
The goal of the waterflooding
The goal of the water flooding is to inject the least possible water to produce the most possible oil in the shortest possible time.
Workflow
- Upload the required data
- Gridding - Divide the field into Blocks/Patterns using the Bubble map by identifying dominant no-flow boundaries. No-flow boundary is a line in the reservoir where reservoir fluids do not cross. Oil and water on either side of the line flow away from this line.
- Calculate the well allocation factors WAF for blocks/patterns.
- Calculate each block/pattern cumulative fluids production and injection volumes. Number of active producers and injectors. Current and total well stock.
- Calculate HCPV from the blocks/patterns areas and Well Log Interpretation summaries
- Match total HCPV to the STOIIP numbers by changing the edge Blocks areas
- Calculate waterflood performance indicators: HCPVinj, RF, VRR, VRRcum
- Make Plots (by field, by reservoir, by block): History, RF vs HCPVinj, RF vs well spacing, WOR vs Np, VRR vs t
- Make Maps (by reservoir) showing Blocks: HCPV, HCPVinj, RF, VRR
- Make Cross sections
- Calculate Blocks Enhancement List
- Create Action List
- Execute
Repeat steps 5-6-7-8-9-10 routinely (monthly, quarterly, half year).
Data Required
- Create Fields
- Create/upload Reservoirs
- Upload PVT
- Upload Wells
- Upload Monthly Measures
- Upload Deviation Surveys
- Upload Well Log Interpretations (Note that at the moment for HCPV calculations EP Portal averages data across the uploaded versions. It is recommended to use 1 version of the well log interpretation for MWFA)
Action List
The typical actions are:
- Convert producing well to injector
- Shut in inefficient injection well, water-cyclers
- Increase/Decrease well injection rate
- Add/squeeze Perforations at producing or injection wells
- Drill infill production/injection well
References
Wolcott, D. ; Applied Waterflood Field Development, Energy Tribune Publishing Inc., 2009.
Pages in category "Mature Water Flood Analysis"
The following 12 pages are in this category, out of 12 total.


