Difference between revisions of "Well Nodal Analysis"
(→New Petroleum Engineering Workflow) |
|||
| (64 intermediate revisions by the same user not shown) | |||
| Line 1: | Line 1: | ||
| − | == | + | ==Brief== |
[[File:Well Nodal Analysis.png|thumb|right|400px| Well Nodal Analysis]] | [[File:Well Nodal Analysis.png|thumb|right|400px| Well Nodal Analysis]] | ||
| − | [[Well Nodal Analysis]] is the fundamental [[Petroleum Engineering|petroleum engineering]] technique published in '''1979''' by Joe Mach <ref name=JoeMach/>. For his invention Joe Mach was [https://youtu.be/xArtxcT5joc?t=2749 honored] as JPT Legend of Production and Operations in 2009<ref name=Legends/>. | + | [[Well Nodal Analysis]] is the fundamental [[Petroleum Engineering|petroleum engineering]] technique published in '''1979''' by Joe Mach <ref name=JoeMach/>. For his invention Joe Mach was [https://youtu.be/xArtxcT5joc?t=2749 honored] as a JPT Legend of Production and Operations in 2009<ref name=Legends/>. |
[[Well Nodal Analysis]] is used to predict the well rate and performance by combining the reservoir inflow with the wellbore lift capacity by intersecting the [[IPR]] and [[VLP]] curves on a pressure vs rate plot. | [[Well Nodal Analysis]] is used to predict the well rate and performance by combining the reservoir inflow with the wellbore lift capacity by intersecting the [[IPR]] and [[VLP]] curves on a pressure vs rate plot. | ||
| Line 8: | Line 8: | ||
For the given reservoir [[Well Nodal Analysis]] calculates how much oil, water and gas can be produced by the given well. | For the given reservoir [[Well Nodal Analysis]] calculates how much oil, water and gas can be produced by the given well. | ||
| − | [[Well Nodal Analysis]] | + | [[:Category:PQplot | PQplot]] is a [[Well Nodal Analysis]] software available online at [https://www.pengtools.com/pqPlot www.pengtools.com]. |
==The Power of Well Nodal Analysis== | ==The Power of Well Nodal Analysis== | ||
| + | [[File:Location of various nodes.png|thumb|right|400px| Location of various nodes <ref name=JoeMach/>]] | ||
| − | + | [[Well Nodal Analysis]] is the cornerstone of [[Petroleum Engineering| petroleum engineering]]. It allows to: | |
| − | |||
| − | |||
| − | |||
| − | + | # Calculate the well [[Production Potential | production potential]] and identify the performance gaps to maximize oil and gas production. | |
| + | # Evaluate the various well nodes impact on production. Nodes: reservoir, perforation, tubing string, restrictions, downhole safety valves, the surface chokes, the surface flow lines and separator. | ||
| − | + | ==Typical Applications== | |
| + | * Estimation of well [[Production Potential | production potential]] and absolute open flow (AOF) | ||
| + | * Tubing sizing | ||
| + | * Selection of the operating wellhead pressures | ||
| + | * Artificial lift design. Gas lift. [[ESP]] sizing. | ||
| + | * Sensitivity studies | ||
| − | [[ | + | ==Math and Physics== |
| + | [[Well Nodal Analysis]] is done on a pressure vs rate plot. [[IPR]] and [[VLP]] curves intersect at well operating point. | ||
| − | + | Well [[IPR]] curve: [[Darcy's law]], [[Vogel's IPR]], [[Composite IPR]]. | |
| − | |||
| − | |||
| − | |||
| − | |||
| − | |||
| − | + | Well [[VLP]] curve: [[Hagedorn and Brown]] multiphase flow correlation | |
| − | == | + | ==Example== |
| − | + | Given data<ref name=JoeMach/>: | |
| − | + | SG<sub>g</sub>=0.65, SG<sub>o</sub>=35 API, P<sub>r</sub>=2200 psi, P<sub>b</sub>=1800 psi, T<sub>r</sub>=140 F, depth = 5000ft, tubing size = 2 3/8 in OD, GOR=400 scf/stb, WOR=0 | |
| + | Productivity index J = 1 bbl/d/psi | ||
| + | It's required to find the well flowing rate at the wellhead pressure of 230 psi. Surface flow line and separator are not in question. | ||
| + | ===Solution at bottom of well === | ||
| + | In order to solve for the flow rate at bottomhole (node position 6), the entire system is divided into two components, the reservoir or well capability component, [[IPR]] and the piping system component, [[VLP]] <ref name= KermitBrown1984/>. | ||
| + | |||
| + | :First, [[Vogel's IPR | Vogel's equation]] is used to calculate the [[IPR]] curve. The AOF = 1400 bbl/d | ||
| + | |||
| + | <table border="1" cellpadding="3" cellspacing="1"> | ||
| + | <tr><th>Rate, bbl/d</th><th>Pwf, psi</th></tr> | ||
| + | <tr><td>0</td><td>2200</td></tr> | ||
| + | <tr><td>200</td><td>2000</td></tr> | ||
| + | <tr><td>400</td><td>1800</td></tr> | ||
| + | <tr><td>600</td><td>1590</td></tr> | ||
| + | <tr><td>800</td><td>1350</td></tr> | ||
| + | <tr><td>1000</td><td>1067</td></tr> | ||
| + | <tr><td>1400</td><td>0</td></tr> | ||
| + | </table> | ||
| + | |||
| + | |||
| + | :Second, [[Hagedorn and Brown]] multiphase flow correlation is used to calculate the required tubing intake pressures at the given wellhead pressure, [[VLP]] curve. | ||
| + | |||
| + | <table border="1" cellpadding="3" cellspacing="1"> | ||
| + | <tr><th>Rate, bbl/d</th><th>Pwf, psi</th></tr> | ||
| + | <tr><td>0</td><td>1929</td></tr> | ||
| + | <tr><td>200</td><td>1065</td></tr> | ||
| + | <tr><td>400</td><td>1125</td></tr> | ||
| + | <tr><td>600</td><td>1181</td></tr> | ||
| + | <tr><td>800</td><td>1235</td></tr> | ||
| + | <tr><td>1000</td><td>1289</td></tr> | ||
| + | <tr><td>1400</td><td>1399</td></tr> | ||
| + | </table> | ||
| + | |||
| + | |||
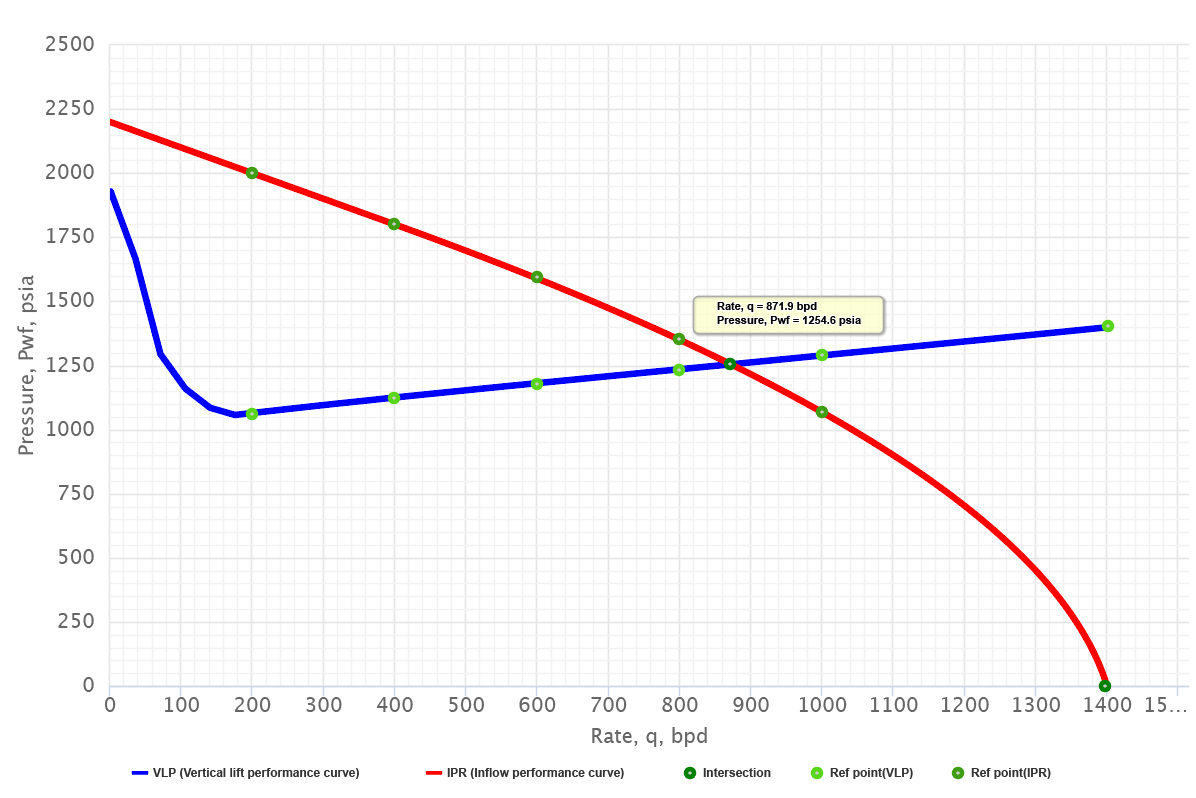
| + | :Third, [[IPR]] and [[VLP]] curves are plotted on the pressure vs rate plot. The intersection of these two curves shows the flow rate to be 872 bbl/d. | ||
| + | |||
| + | [[File:Well Nodal Analysis Example.png | link=https://www.pengtools.com/pqPlot?paramsToken=7db370789c234c0949337f8b1978fa3c | Solution at Bottom of Well]] | ||
| + | |||
| + | {{Quote| text = This is "the rate" possible for this system. It is not a maximum, minimum, or optimum but is the rate at which this well will produce for the piping system installed. The rate can be changed only by changing something in the system - that is, pipe sizes, choke or by shifting the [[IPR]] curve through simulation treatment. | source = Kermit Brown et al <ref name= KermitBrown1984/>}} | ||
== See also == | == See also == | ||
| Line 68: | Line 106: | ||
|url-access=registration | |url-access=registration | ||
| + | }}</ref> | ||
| + | |||
| + | <ref name= KermitBrown1984 >{{cite book | ||
| + | |last1= Brown |first1= Kermit | ||
| + | |title=The Technology of Artificial Lift Methods. Volume 4. Production Optimization of Oil and Gas Wells by Nodal System Analysis | ||
| + | |publisher=PennWellBookss | ||
| + | |date=1984 | ||
| + | |place=Tulsa, Oklahoma | ||
}}</ref> | }}</ref> | ||
Latest revision as of 18:47, 8 July 2023
Contents
Brief

Well Nodal Analysis is the fundamental petroleum engineering technique published in 1979 by Joe Mach [1]. For his invention Joe Mach was honored as a JPT Legend of Production and Operations in 2009[2].
Well Nodal Analysis is used to predict the well rate and performance by combining the reservoir inflow with the wellbore lift capacity by intersecting the IPR and VLP curves on a pressure vs rate plot.
For the given reservoir Well Nodal Analysis calculates how much oil, water and gas can be produced by the given well.
PQplot is a Well Nodal Analysis software available online at www.pengtools.com.
The Power of Well Nodal Analysis

Well Nodal Analysis is the cornerstone of petroleum engineering. It allows to:
- Calculate the well production potential and identify the performance gaps to maximize oil and gas production.
- Evaluate the various well nodes impact on production. Nodes: reservoir, perforation, tubing string, restrictions, downhole safety valves, the surface chokes, the surface flow lines and separator.
Typical Applications
- Estimation of well production potential and absolute open flow (AOF)
- Tubing sizing
- Selection of the operating wellhead pressures
- Artificial lift design. Gas lift. ESP sizing.
- Sensitivity studies
Math and Physics
Well Nodal Analysis is done on a pressure vs rate plot. IPR and VLP curves intersect at well operating point.
Well IPR curve: Darcy's law, Vogel's IPR, Composite IPR.
Well VLP curve: Hagedorn and Brown multiphase flow correlation
Example
Given data[1]:
SGg=0.65, SGo=35 API, Pr=2200 psi, Pb=1800 psi, Tr=140 F, depth = 5000ft, tubing size = 2 3/8 in OD, GOR=400 scf/stb, WOR=0
Productivity index J = 1 bbl/d/psi
It's required to find the well flowing rate at the wellhead pressure of 230 psi. Surface flow line and separator are not in question.
Solution at bottom of well
In order to solve for the flow rate at bottomhole (node position 6), the entire system is divided into two components, the reservoir or well capability component, IPR and the piping system component, VLP [3].
- First, Vogel's equation is used to calculate the IPR curve. The AOF = 1400 bbl/d
| Rate, bbl/d | Pwf, psi |
|---|---|
| 0 | 2200 |
| 200 | 2000 |
| 400 | 1800 |
| 600 | 1590 |
| 800 | 1350 |
| 1000 | 1067 |
| 1400 | 0 |
- Second, Hagedorn and Brown multiphase flow correlation is used to calculate the required tubing intake pressures at the given wellhead pressure, VLP curve.
| Rate, bbl/d | Pwf, psi |
|---|---|
| 0 | 1929 |
| 200 | 1065 |
| 400 | 1125 |
| 600 | 1181 |
| 800 | 1235 |
| 1000 | 1289 |
| 1400 | 1399 |
- Third, IPR and VLP curves are plotted on the pressure vs rate plot. The intersection of these two curves shows the flow rate to be 872 bbl/d.
This is "the rate" possible for this system. It is not a maximum, minimum, or optimum but is the rate at which this well will produce for the piping system installed. The rate can be changed only by changing something in the system - that is, pipe sizes, choke or by shifting the IPR curve through simulation treatment.— Kermit Brown et al [3]
See also
References
- ↑ 1.0 1.1 1.2
Mach, Joe; Proano, Eduardo; Brown, Kermit E. (1979). "A Nodal Approach For Applying Systems Analysis To The Flowing And Artificial Lift Oil Or Gas Well"
 (SPE-8025-MS). Society of Petroleum Engineers.
- ↑
JPT, staff (2009). "Legends of Production and Operation". Journal of Petroleum Technology. Society of Petroleum Engineers (SPE-1209-0033-JPT).
- ↑ 3.0 3.1 Brown, Kermit (1984). The Technology of Artificial Lift Methods. Volume 4. Production Optimization of Oil and Gas Wells by Nodal System Analysis. Tulsa, Oklahoma: PennWellBookss.