Difference between revisions of "VLP"
From wiki.pengtools.com
| Line 17: | Line 17: | ||
On the other hand the hook right here is caused by the liquid dominating gas. | On the other hand the hook right here is caused by the liquid dominating gas. | ||
| + | |||
| + | ==VLP calculator software== | ||
| + | *[[:Category:PQplot | PQplot]] nodal analysis software is used to calculate the [[VLP]] curves. [[:Category:PQplot | PQplot]] is available online at [https://www.pengtools.com www.pengtools.com]. | ||
| + | *Excel | ||
| + | *other | ||
==See also== | ==See also== | ||
Revision as of 06:36, 27 April 2020
Vertical Lift Performance
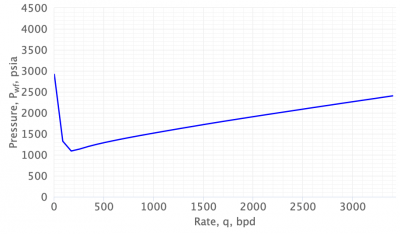
VLP - Vertical Lift Performance curve is a relationship between the flow rate and the pressure.
VLP curve shows how much pressure required to lift a certain amount of fluid to the surface at the given well head pressure.
VLP curve is used in Nodal Analysis for production systems design, analysis and optimization.
Math and Physics
This VLP curve was calculated using the Hagedorn and Brown.
You can see what the higher the rate the higher the pressure required. This is related to the friction forces.
On the other hand the hook right here is caused by the liquid dominating gas.
VLP calculator software
- PQplot nodal analysis software is used to calculate the VLP curves. PQplot is available online at www.pengtools.com.
- Excel
- other