3 Phase IPR
Contents
Three-phase Inflow Performance Relationship

3 Phase IPR is an IPR curve calculated on the basis of total barrels of produced fluid, including gas.
3 Phase IPR used in Pump Design software for pump sizing.
Math and Physics
Total flow rate equations:
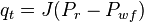
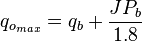
For Pb < Pwf < Pr
For pressures between reservoir pressure and bubble point pressure:
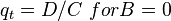
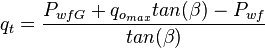
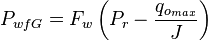
For PwfG < Pwf < Pb
For pressures between the bubble point pressure and the flowing bottom-hole pressures:
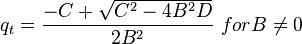
where:
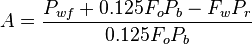
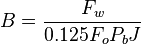
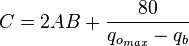
For 0 < Pwf < PwfG
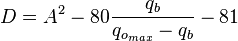
where:
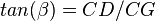

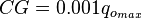
And
3 Phase IPR calculation example

Following the example problem #21, page 33 [1]:
Given:
 = 2550 psi
 = 2100 psi
Test data:
 = 2300 psi
 = 500 b/d
Calculate:
Determine the 3 Phase IPR curves for Fw=0, 0.25, 0.5, 0.75, and 1.
Solution:
The problem was run through PQplot software for different values of watercut.
Result 3 Phase IPR curves are shown on Fig.1. Points indicate results obtained by Brown [1].
The PQplot model from this example is available online by the following link: 3 Phase IPR calculation example
Nomenclature
 = calculation variables
 = oil fraction, fraction
 = water fraction, fraction
 = productivity index, stb/d/psia
 = pressure, psia
 = flowing rate, stb/d
Subscripts
- b = at bubble point
- max = maximum
- o = oil
- r = reservoir
- t = total
- wf = well flowing bottomhole pressure
- wfG = well flowing bottomhole pressure at point G