Bubble map
From wiki.pengtools.com
Brief
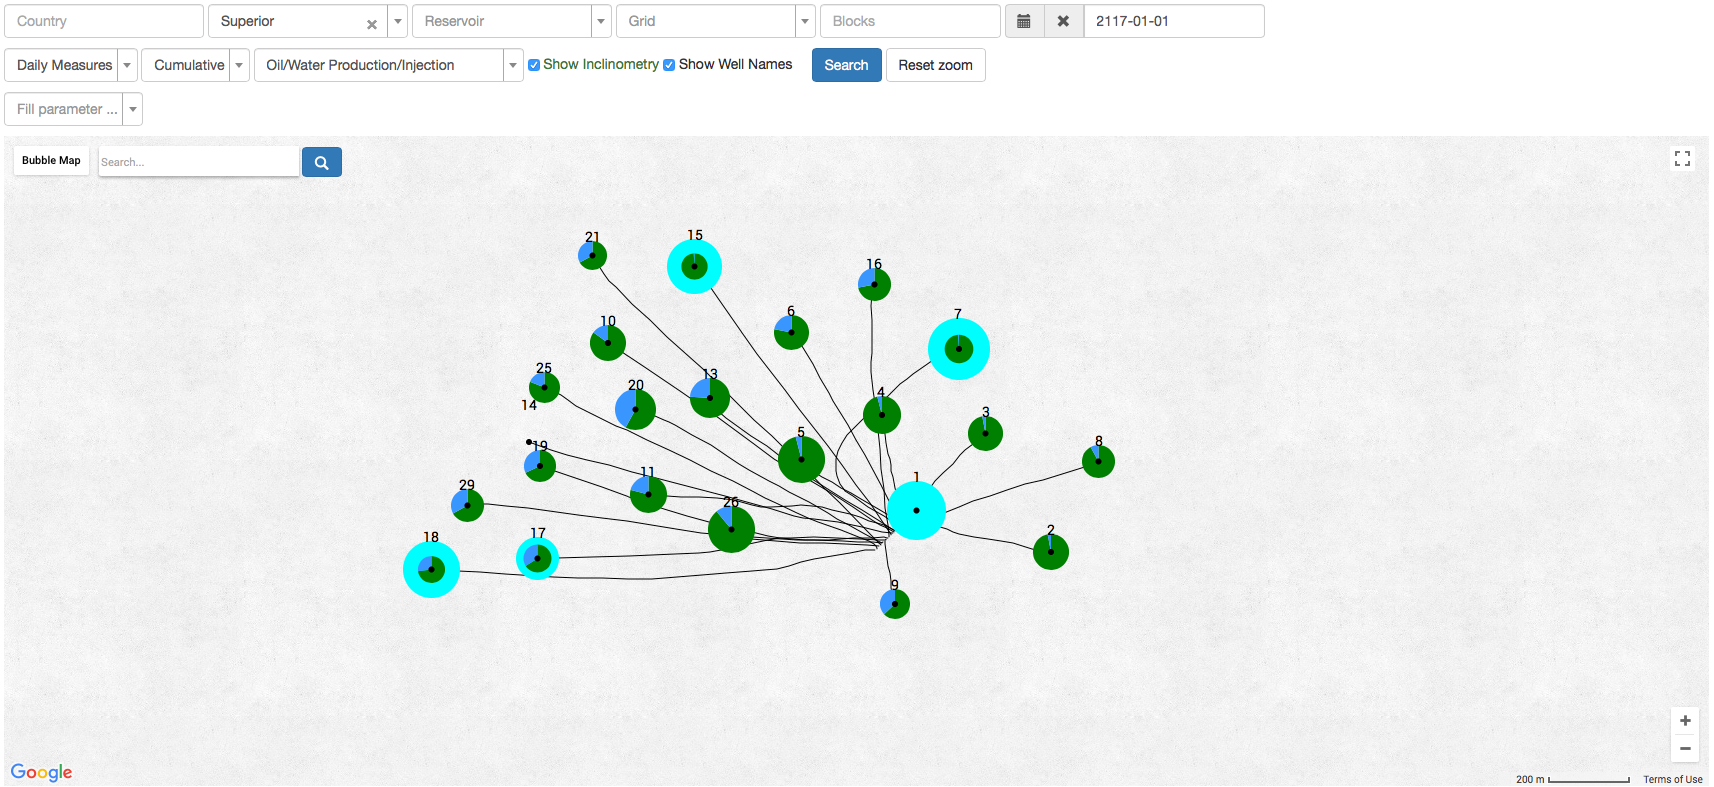
Bubble map is a representation of the Wells Daily Measures on a map.
Common Bubble map representations are cumulative oil produced or water injected, rate per well with water cut fraction etc.
Discussion
There is no analytical or physical based result that can be directly concluded from an inspection of at the typical Bubble map [1].
Date Required
Bubble maps are uploaded to the E&P Portal here.
See Also
References
- ↑
Wolcott, Don (2009). Applied Waterflood Field Development
 . Houston: Energy Tribune Publishing Inc.

