Difference between revisions of "Hall Plot"
(→Hall Plot Application with Wellhead Pressure) |
(→Hall Plot Application with Wellhead Pressure) |
||
| Line 29: | Line 29: | ||
===Hall Plot Application with Wellhead Pressure=== | ===Hall Plot Application with Wellhead Pressure=== | ||
| − | Since bottomhole pressure and reservoir pressure are not readily available, the [[Hall Plot]] can be used with tubing head pressure | + | Since bottomhole pressure and reservoir pressure are not readily available, the [[Hall Plot]] can be used with tubing head pressure. |
===Application with Tubing Head Pressure=== | ===Application with Tubing Head Pressure=== | ||
Revision as of 16:19, 27 August 2026
Contents
Brief
Hall Plot is the engineering technique to analyze performance of injection wells published in 1963 by Howard Hall [1].
Hall Plot is applied to determine the change in the Injectivity index of the wells.
Hall Plot uses readily available Well flowing data: injection rate and wellhead pressures.
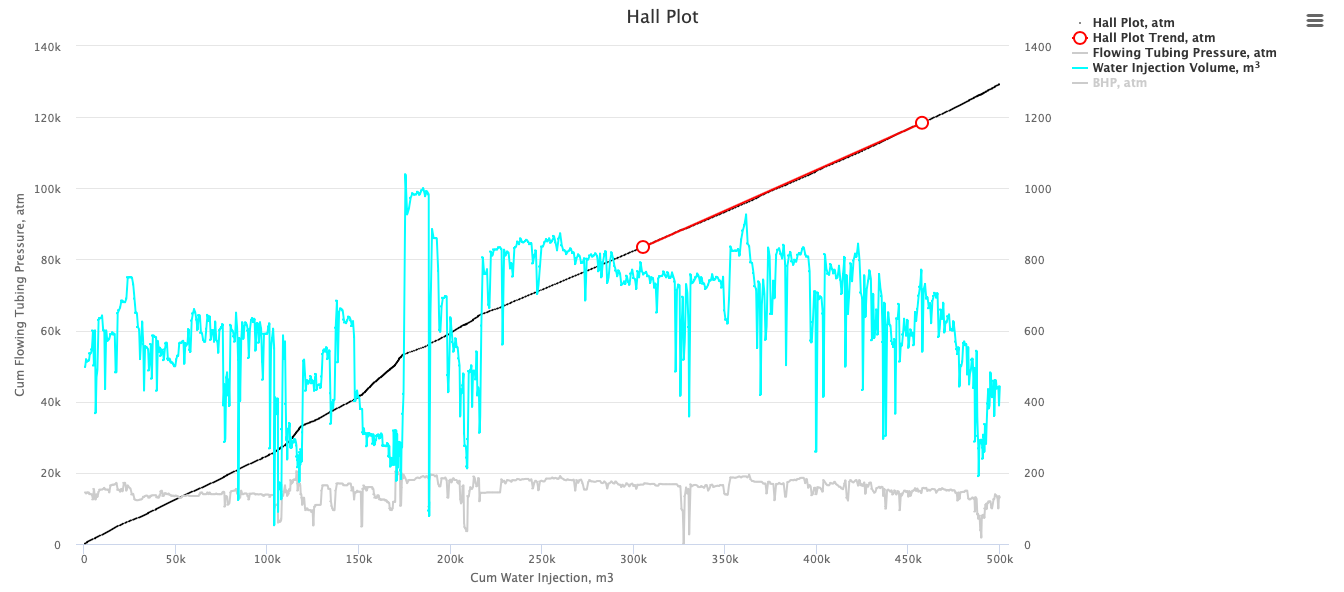
The interpretation technique is fitting the data points with the straight lines to estimate injectivity change.
Math & Physics
From Darcy's law for an unfractured injection well located in the center of a circular drainage area, the injection rate in pseudo-steady state is:

Hall integrated both sides with respect to time [2]:

The Cartesian graph of cumulative injection versus cumulative  yields a straight line with slope:
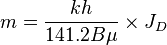
and Injectivity index is:

Hall Plot Application with Wellhead Pressure
Since bottomhole pressure and reservoir pressure are not readily available, the Hall Plot can be used with tubing head pressure.
Application with Tubing Head Pressure
[your derivation here]
Rearranging:

Given:

Nomenclature
See Also
- ↑ Hall, H.N. (1963). "How To Analyze Waterflood Injection Well Performance". World Oil.
- ↑ Buell, R.S.; Kazemi, H.; Poettmann, F.H. (1990). "Analyzing Injectivity of Polymer Solutions With the Hall Plot". SPE Reservoir Engineering. 5 (1). doi:10.2118/16963-PA.