Difference between revisions of "Enhancement Tracking"
(→Case Study) |
(→Case Study) |
||
| Line 47: | Line 47: | ||
All the input and output data is attached to the Case Study for the reference. | All the input and output data is attached to the Case Study for the reference. | ||
| − | [[File:Enhancment_Tracking_Case_Study.png|200px |link=https://wiki.pengtools.com/images/ | + | [[File:Enhancment_Tracking_Case_Study.png|200px |link=https://wiki.pengtools.com/images/d/de/Enhancement_Tracking_CaseStudy.pdf ]] |
[[Media:Enhancement_Tracking_CaseStudy.pdf|Download Case Study (pdf)]] | [[Media:Enhancement_Tracking_CaseStudy.pdf|Download Case Study (pdf)]] | ||
Revision as of 13:34, 31 July 2018
Contents
Brief
Enhancement Tracking is a workflow to assess the benefits achieved by executed Enhancements [1].
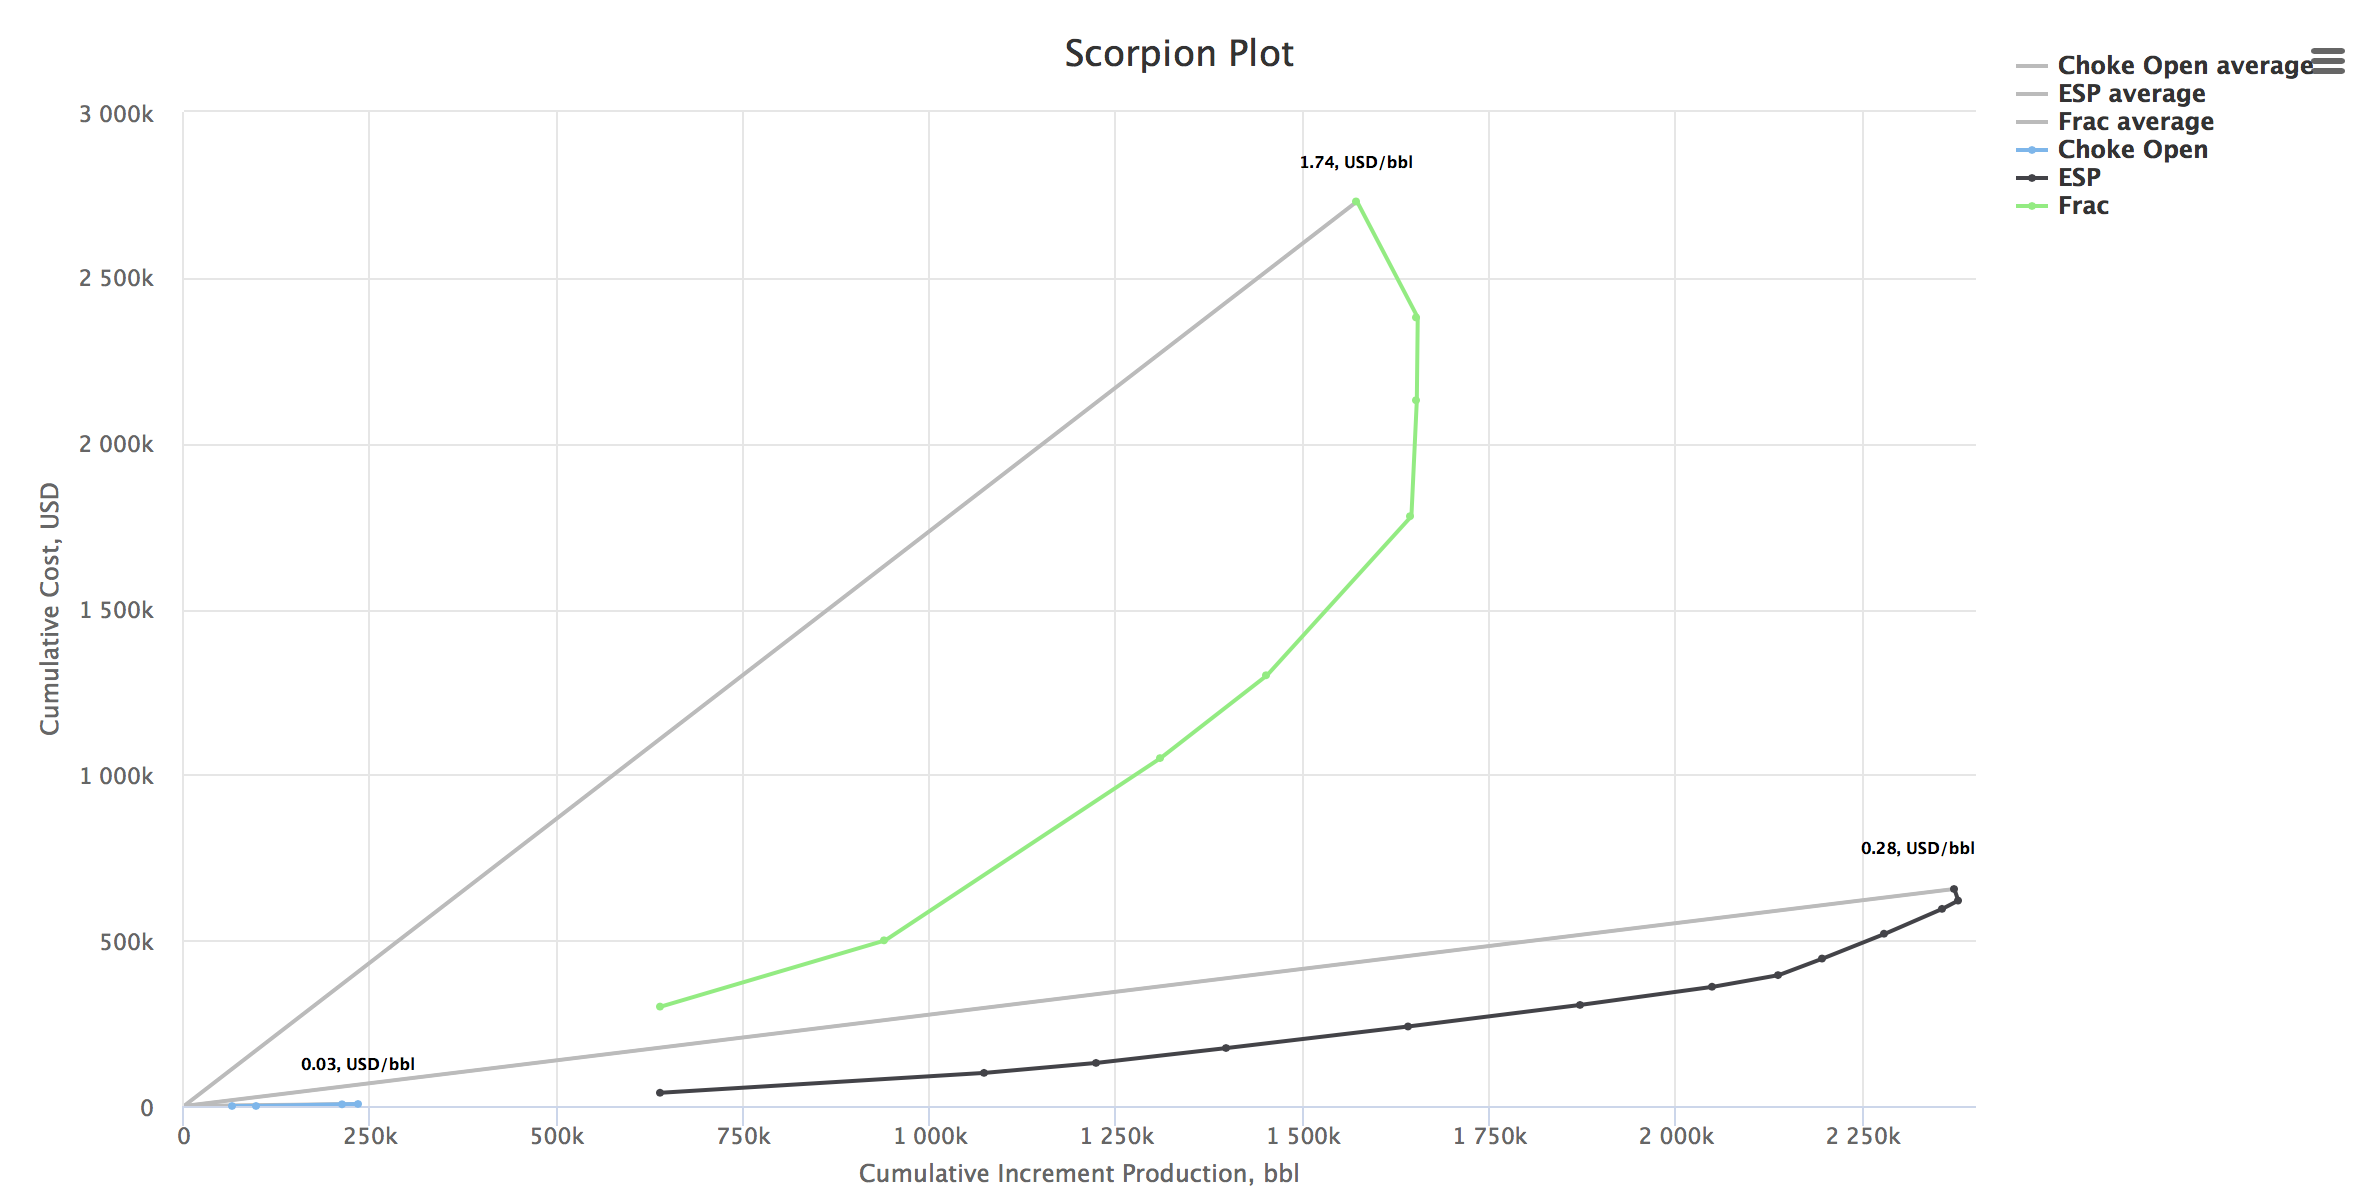
As a result Enhancement Tracking provides a Scorpion Plot which answers those questions:
- What is the campaign total incremental oil recovery [IOR] vs total cost?
- Which enhancement campaign has better $/bbl performance?
- Which well has better $/bbl performance?
- What is the IOR for each enhancement?
Math and Physics
The incremental oil recovery (IOR) for the given Enhancement is:
where:
- V2 - production increase due to Enhancement,
- V1 - production loss due to downtime,
- V3 - production loss due to decline rate.
IOR is calculated to selected Enhancement lifetime or economic limit.
Decline Curves are used to model base (before) and enhanced (after) well rates.
Scorpion Plot
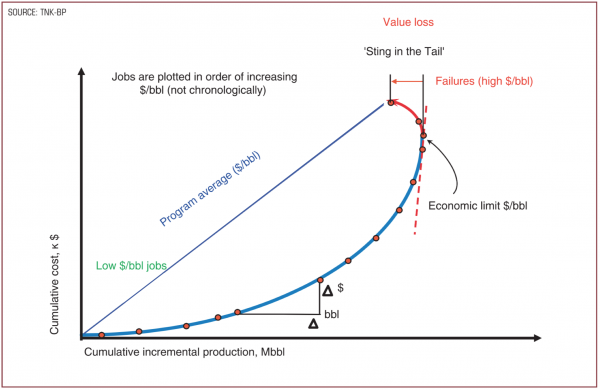
The Scorpion plot graphically illustrates total program split by individual events and ranked by success. The curve initiates from the origin at a low scope (low $/bbl) and increasing until running to a vertical asymptote (money spent with no gain in production) and possibly even a negative portion (money spent and production lost as a result of the intervention). This effectively displays program performance ($/bbl), total volume, total cost, and success rate [2].
Case Study
This Case Study demonstrates the application of the Enhancement Tracking workflow using the E&P Portal.
The Study is based on the enhancement campaign implemented in an oil field located in Siberia, Russia. The campaign included such Enhancements as fracturing, installing and upgrading the ESPs, choke opens and resulted in 4 mln bbl of incremental oil recovery.
It is shown how to:
- Input the required data to the E&P Portal;
- Apply the Enhancement Tracking workflow to track and benchmark enhancements;
- Save and export the analysis results.
All the input and output data is attached to the Case Study for the reference.
Download the attachments (zip, 8 files)
Workflow
- Open the well enhancement page
- Create the decline model before the enhancement - Base Type Curve
- Create the decline model after the enhancement - Enhanced Type Curve
- Inspect the actual IOR vs plan
- Save the model data
- Move to the next well enhancement
Data required
- Create Field here
- Upload Wells
- Upload Daily Measures
- Upload Enhancements Data here
References
- ↑ Martins, J. P.; MacDonald, J. M.; Stewart, C. G.; Phillips, C. J. (1995). "The Management and Optimization of a Major Wellwork Program at Prudhoe Bay"
 (SPE-30649-MS). Society of Petroleum Engineers.
- ↑ 2.0 2.1 2.2 Nguyen, Dzu (September–October 2006). "Improving Performance Management in TNK-BP". Innovator, TNK-BP Technology Magazine (12).
Martins, J. P., MacDonald, J. M., Stewart, C. G., & Phillips, C. J. (1995, January 1). The Management and Optimization of a Major Wellwork Program at Prudhoe Bay. Society of Petroleum Engineers. doi:10.2118/30649-MS


