Difference between revisions of "Bubble map"
| Line 49: | Line 49: | ||
[[Category:Mature Water Flood Analysis]] | [[Category:Mature Water Flood Analysis]] | ||
[[Category:Reservoir Management]] | [[Category:Reservoir Management]] | ||
| + | |||
| + | {{#seo: | ||
| + | |title=Bubble map | ||
| + | |titlemode= replace | ||
| + | |keywords=Bubble map | ||
| + | |description=Bubble map is a representation of the wells production volumes and rates on a map. | ||
| + | }} | ||
Latest revision as of 09:29, 6 December 2018
Brief
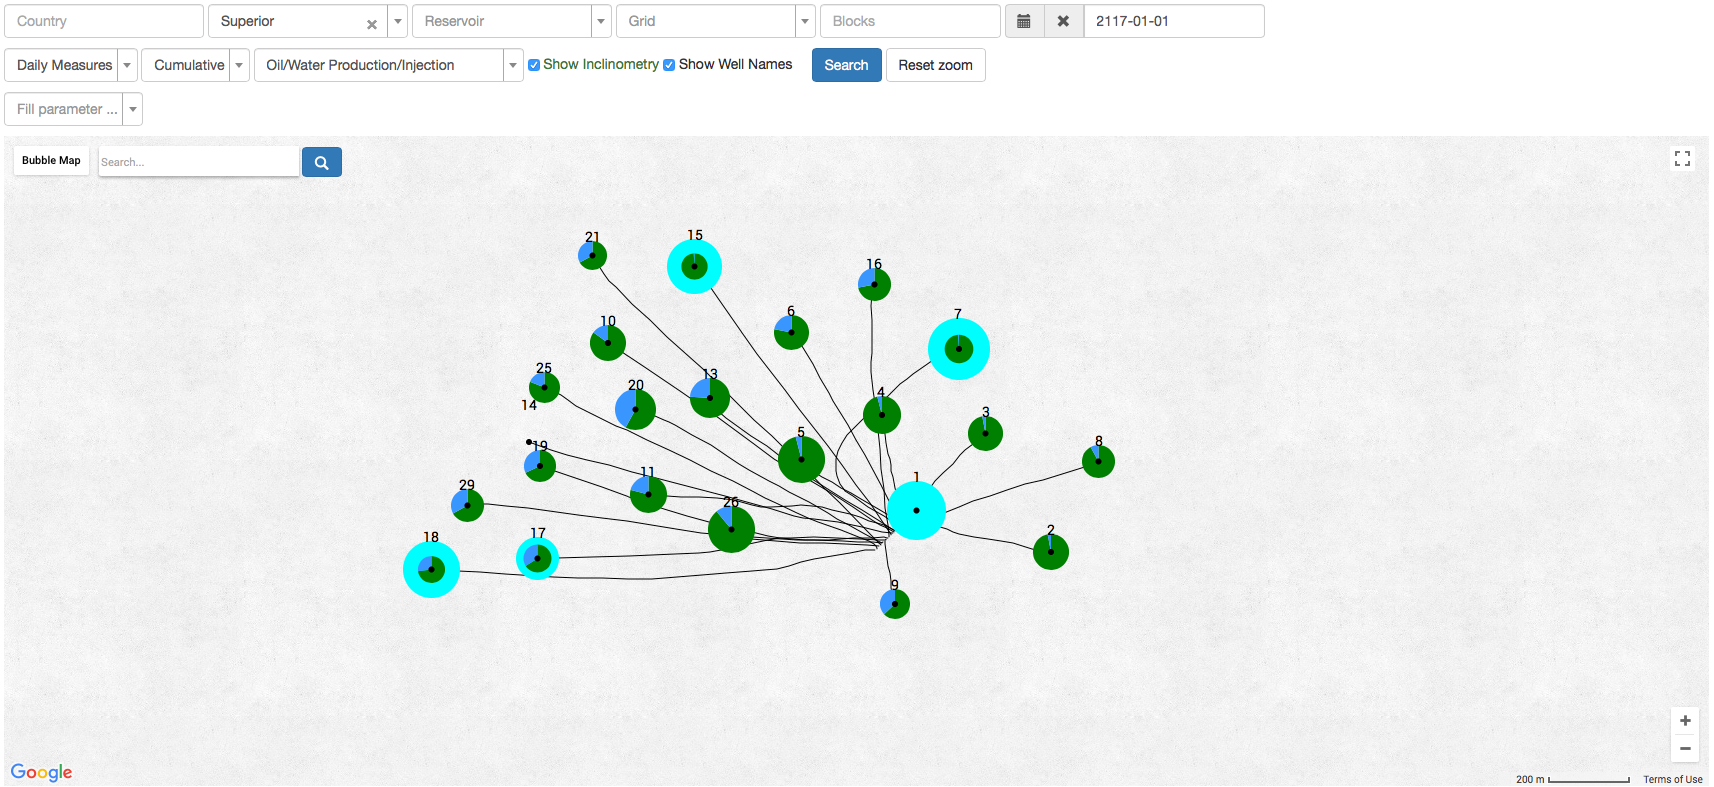
Bubble map is a representation of the Wells Daily Measures on a map.
Common Bubble map representations are cumulative oil produced or water injected, rate per well with water cut fraction etc[1].
The most important use of Bubble map is visualizing the Field, selecting Patterns or wells within that Field, and mining the data[1].
Discussion
There is no analytical or physical based result that can be directly concluded from an inspection of at the typical Bubble map [1].
Analytical calculations must be conducted to determine potential and compared with performance to identify gaps[1].
Analytical calculations most helpful or waterflood engineers would be those focused on Patterns. See Mature Water Flood Analysis.
Date Required
- Create Field here
- Upload Wells
- Upload Deviation Surveys
- Upload Daily Measures or Upload Monthly Measures here
See Also
References
- ↑ 1.0 1.1 1.2 1.3
Wolcott, Don (2009). Applied Waterflood Field Development
 . Houston: Energy Tribune Publishing Inc.

