Difference between revisions of "P/Z plot"
| (65 intermediate revisions by the same user not shown) | |||
| Line 1: | Line 1: | ||
__TOC__ | __TOC__ | ||
== Brief == | == Brief == | ||
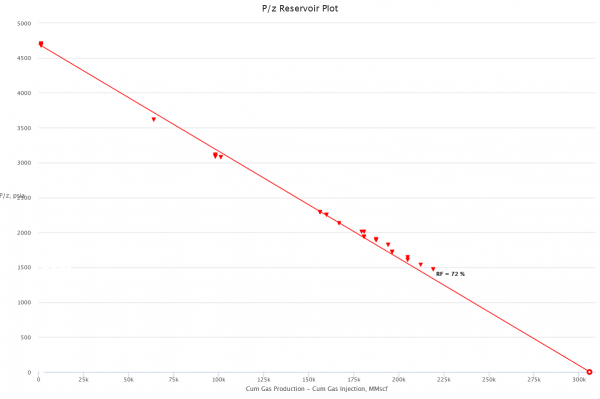
| − | The [[P/Z plot]] is a plot of P/z versus cumulative gas production, G<sub>p</sub>. | + | The [[P/Z plot]] is a plot of P/z versus [[Reservoirs | Reservoir]] cumulative gas production, G<sub>p</sub>. |
The interpretation technique is fitting the data points with the straight line to estimate GIIP. | The interpretation technique is fitting the data points with the straight line to estimate GIIP. | ||
The [[P/Z plot]] is based on the [[Gas Material Balance]] equation. | The [[P/Z plot]] is based on the [[Gas Material Balance]] equation. | ||
| + | |||
| + | [[File:PoverZ.png|thumb|right|600px|link=https://ep.pengtools.com/reservoir/plots| P/Z plot at ep.pengtools.com|right]] | ||
== Math & Physics == | == Math & Physics == | ||
Applying [[Real Gas]] [[EOS]] at reservoir conditions: | Applying [[Real Gas]] [[EOS]] at reservoir conditions: | ||
| − | :<math> PV_r=z\frac{m}{M} RT_r</math> (1) | + | :<math> PV_r=z\frac{m}{M} RT_r</math> (1) |
Applying [[Real Gas]] [[EOS]] at standard conditions: | Applying [[Real Gas]] [[EOS]] at standard conditions: | ||
| − | :<math> P_{SC}V_g=1\frac{m}{M} RT_{SC}</math> (2) | + | :<math> P_{SC}V_g=1\frac{m}{M} RT_{SC}</math> (2) |
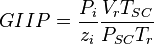
Dividing eq. 2 by eq. 1 and rearranging: | Dividing eq. 2 by eq. 1 and rearranging: | ||
| − | :<math> V_g=\frac{P}{z} \frac{V_rT_{SC}}{P_{SC}T_{r}}</math>(3) | + | :<math> V_g=\frac{P}{z} \frac{V_rT_{SC}}{P_{SC}T_{r}}</math> (3) |
Applying eq. 3 for initial conditions and for any point in time: | Applying eq. 3 for initial conditions and for any point in time: | ||
| Line 34: | Line 36: | ||
== Discussion == | == Discussion == | ||
| − | [[ | + | [[P/Z plot]] is a part of the [[Reservoir Management]] workflow in the [[:Category:E&P Portal | E&P Portal]] used to estimate [[Reservoirs]] GIIP and recovery. |
| + | |||
| + | '''Example 1. Multiple Reservoirs on the same [[P/Z plot]]''' in the [[:Category:E&P Portal | E&P Portal]] | ||
| + | |||
| + | [[File:Poverz_multiple_reservoirs.png]] | ||
| + | |||
| + | |||
| + | [[Gas Flowing Material Balance]] is the more advanced tool to determine the [[Reservoirs]] GIIP and recovery as well as [[Well]]'s [[EUR]] and [[JD]]. | ||
| + | |||
| + | == Workflow == | ||
| + | # Upload the data required | ||
| + | # Go to the [[Reservoir Management]] -> [https://ep.pengtools.com/reservoir/plots Performance Plots] | ||
| + | # Select the [[Reservoirs]] you want to see and the Data range and click "Search" | ||
| + | # Scroll down the Performance Plots to see the [[P/Z plot]] | ||
| + | |||
| + | === Data Required=== | ||
| + | {{Data required for Reservoir Management}} | ||
| + | |||
| + | == See also == | ||
| + | [[Gas Flowing Material Balance]]<BR/> | ||
| + | [[Gas Material Balance]]<BR/> | ||
== Nomenclature == | == Nomenclature == | ||
| − | :<math> GIIP </math> = gas initially in place, | + | :<math> GIIP </math> = gas initially in place, scf |
| + | :<math> G_p </math> = cumulative gas produced, scf | ||
:<math> P </math> = reservoir pressure (changing), psia | :<math> P </math> = reservoir pressure (changing), psia | ||
:<math> P_{i} </math> = initial reservoir pressure (constant), psia | :<math> P_{i} </math> = initial reservoir pressure (constant), psia | ||
:<math> P_{SC} </math> = pressure at standard conditions, psia | :<math> P_{SC} </math> = pressure at standard conditions, psia | ||
| − | :<math> T_i </math> = initial reservoir | + | :<math> T_i </math> = initial reservoir temperature (constant), °R |
| − | :<math> T_r </math> = reservoir | + | :<math> T_r </math> = reservoir temperature (constant), °R |
:<math> T_{SC} </math> = temperature at standard conditions (constant), °R | :<math> T_{SC} </math> = temperature at standard conditions (constant), °R | ||
| + | :<math> V_g </math> = volume of gas in reservoir converted to standard conditions (changing), scf | ||
:<math> V_r </math> = reservoir volume (constant), ft<sup>3</sup> | :<math> V_r </math> = reservoir volume (constant), ft<sup>3</sup> | ||
| − | |||
:<math> z </math> = gas compressibility factor (changing), dimensionless | :<math> z </math> = gas compressibility factor (changing), dimensionless | ||
| + | :<math> z_i </math> = initial gas compressibility factor (constant), dimensionless | ||
| − | + | [[Category:Reservoir Management]] | |
| − | + | [[Category:E&P Portal]] | |
| − | |||
| − | |||
| − | |||
| − | |||
| − | |||
| − | |||
| − | |||
| − | |||
| − | |||
| − | |||
| − | |||
| − | |||
| − | |||
| − | |||
| − | |||
| − | |||
| − | |||
| − | |||
| − | |||
| − | |||
| − | |||
| − | |||
| − | |||
| − | |||
| − | |||
| − | + | {{#seo: | |
| − | + | |title=P/Z plot to estimate reservoirs GIIP | |
| − | + | |titlemode= replace | |
| − | + | |keywords=giip calculation, reservoir engineering, material balance, petroleum engineering | |
| − | + | |description=P/Z plot is and quick and easy to use tool to estimate reservoirs GIIP. | |
| − | + | }} | |
| − | |||
| − | |||
| − | |||
| − | |||
| − | |||
| − | }} | ||
| − | |||
| − | |||
| − | |||
Latest revision as of 05:22, 8 November 2018
Contents
Brief
The P/Z plot is a plot of P/z versus Reservoir cumulative gas production, Gp.
The interpretation technique is fitting the data points with the straight line to estimate GIIP.
The P/Z plot is based on the Gas Material Balance equation.
Math & Physics
Applying Real Gas EOS at reservoir conditions:
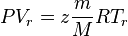 (1)
(1)
Applying Real Gas EOS at standard conditions:
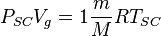 (2)
(2)
Dividing eq. 2 by eq. 1 and rearranging:
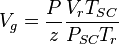 (3)
(3)
Applying eq. 3 for initial conditions and for any point in time:
Applying eq. 3 for any point in time:
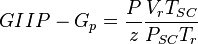
Therefore at any time:
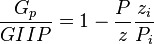
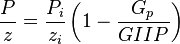
Or:
Thus a plot of P/z vs cumulative produced gas is a straight line intersecting X axis at GIIP.
Discussion
P/Z plot is a part of the Reservoir Management workflow in the E&P Portal used to estimate Reservoirs GIIP and recovery.
Example 1. Multiple Reservoirs on the same P/Z plot in the E&P Portal

Gas Flowing Material Balance is the more advanced tool to determine the Reservoirs GIIP and recovery as well as Well's EUR and JD.
Workflow
- Upload the data required
- Go to the Reservoir Management -> Performance Plots
- Select the Reservoirs you want to see and the Data range and click "Search"
- Scroll down the Performance Plots to see the P/Z plot
Data Required
- Create Field here
- Upload Wells
- Create or Upload Reservoirs here
- Upload Monthly Measures here
- Input the Reservoirs reserves and other data here
- Create or Upload PVT (SG, Pi, Ti) here
In case you need to calculate the Monthly Measures from the Daily Measures:
- Upload Wells
- Upload Daily Measures
- Calculate the Monthly Measures using Monthly Measures Calculator
See also
Gas Flowing Material Balance
Gas Material Balance
Nomenclature
 = gas initially in place, scf
 = cumulative gas produced, scf
 = reservoir pressure (changing), psia
 = initial reservoir pressure (constant), psia
 = pressure at standard conditions, psia
 = initial reservoir temperature (constant), °R
 = reservoir temperature (constant), °R
 = temperature at standard conditions (constant), °R
 = volume of gas in reservoir converted to standard conditions (changing), scf
 = reservoir volume (constant), ft3
 = gas compressibility factor (changing), dimensionless
 = initial gas compressibility factor (constant), dimensionless