Difference between revisions of "Liquid loading"
(→PQplot workflow) |
(→PQplot workflow) |
||
| Line 18: | Line 18: | ||
=== PQplot workflow === | === PQplot workflow === | ||
| − | In order to calculate the liquid loading point in [[PQplot]]: | + | In order to calculate the liquid loading point in [[PQplot]]:<br> |
| − | + | For every point in the [[VLP]] curve:<br> | |
| − | |||
| − | For every point in the [[VLP]] curve: | ||
1. Critical gas velocity at the wellhead is calculated by eq (1)<br> | 1. Critical gas velocity at the wellhead is calculated by eq (1)<br> | ||
2. Wellhead flowing gas velocity is calculated | 2. Wellhead flowing gas velocity is calculated | ||
Revision as of 18:27, 7 May 2024
Brief
Liquid loading is a phenomenon when the gas phase does't provide sufficient transport energy to lift the liquids out of the well.
In 1969 Turner et al. published an empirical correlation defining the Liquid loading gas velocity[1].

Math & Physics
The minimum gas velocity to remove the liquid equation:
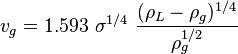 [2] (1)
Note that original paper[1] uses 20.4 constant which is good if the surface tension units are in 'lbf/ft'. Also 20.4 is calculated by adjusting the theoretical equation constant by 20 percent. For the reference PROSPER uses 2.04. PQplot uses 1.593.
The minimum gas rate to remove the liquid equation:
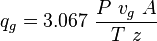 (2)
(2)
PQplot workflow
In order to calculate the liquid loading point in PQplot:
For every point in the VLP curve:
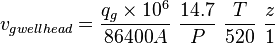
1. Critical gas velocity at the wellhead is calculated by eq (1)
2. Wellhead flowing gas velocity is calculated
3. Liquid loading flag is 1 if:
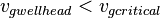
4. Critical gas rate is the last VLP curve point at which liquid loading flag is 1.
Discussion
To avoid the Liquid loading the gas velocity should be above the Liquid loading velocity.
The higher the gas rate the higher the gas velocity.
The lower the wellhead flowing pressure the higher the gas rate.
The bigger the tubing ID the higher the gas rate.
In case when the gas rate is limited by the Reservoir deliverability smaller tubing ID will increase the gas velocity.
Nomenclature
 = flow area, ft^2
 = flowing wellhead pressure, psia
 = gas rate, MMscf/d
 = gas density, lbm/ft3
 = liquid density, lbm/ft3
 = surface tension, dyne/cm (ref values: 60 - water, 20 - condensate) [1]
 = flowing wellhead temperature, °R
 = gas velocity, ft/sec
 = gas compressibility factor at flowing P & T, dimensionless
References
- ↑ 1.0 1.1 1.2 Turner, R. G.; Hubbard, A. E.; Dukler (Nov 1969). "Analysis and Prediction of Minimum Flow Rate for the Continuous Removal of Liquids from Gas Wells"
 . Journal of Petroleum Technology (SPE-2198-PA): 1475–1482.
- ↑ Lea, J. F.; Nickens, M.; Wells (2011). Gas Well Deliquification
 . Energy Tribune Publishing Inc.