Difference between revisions of "Hydraulic Fracturing Design Optimization - Bakken Case Study"
(→Bakken Case Study Discussion and Conclusions) |
|||
| (22 intermediate revisions by the same user not shown) | |||
| Line 4: | Line 4: | ||
[[File:Big Data vs Type Curves Bakken Case Study.png|thumb|right|400px| Big Data vs Type Curves Bakken Case Study]] | [[File:Big Data vs Type Curves Bakken Case Study.png|thumb|right|400px| Big Data vs Type Curves Bakken Case Study]] | ||
| − | The case study is prepared to illustrate the | + | The case study is prepared to illustrate the unified approach to optimize the design of multiple transverse fractures in a horizontal well using the [[:category:optiFracMS | optiFracMS]] software. |
The goal of the study is to optimize a fracturing design for a Bakken formation. | The goal of the study is to optimize a fracturing design for a Bakken formation. | ||
| Line 11: | Line 11: | ||
#Operating company fracture design based on a Big Data application | #Operating company fracture design based on a Big Data application | ||
| − | #Optimized fracturing design based on the | + | #Optimized fracturing design based on the Type Curves |
For the both cases a production forecast was calculated and cumulative oil production was compared. | For the both cases a production forecast was calculated and cumulative oil production was compared. | ||
| + | |||
| + | Optimized fracture design case predicts 61% more cumulative oil in the first year of well production. | ||
==Inputs== | ==Inputs== | ||
| Line 59: | Line 61: | ||
<tr><td>SG oil, API</td><td>30</td></tr> | <tr><td>SG oil, API</td><td>30</td></tr> | ||
<tr><td>Bubble point, psia</td><td>1000</td></tr> | <tr><td>Bubble point, psia</td><td>1000</td></tr> | ||
| + | <tr><td>Oil formation volume factor, bbl/stb</td><td>1.11</td></tr> | ||
<tr><td>Solution gas ratio, scf/bbl</td><td>162.8</td></tr> | <tr><td>Solution gas ratio, scf/bbl</td><td>162.8</td></tr> | ||
<tr><td>Oil compressibility, 1/psi</td><td>4e-06</td></tr> | <tr><td>Oil compressibility, 1/psi</td><td>4e-06</td></tr> | ||
| Line 69: | Line 72: | ||
==Hydraulic Fracturing Design Cases== | ==Hydraulic Fracturing Design Cases== | ||
<table border="1" cellpadding="3" cellspacing="1"> | <table border="1" cellpadding="3" cellspacing="1"> | ||
| − | <tr ><th>Parameters</th><th>Big Data</th><th> | + | <tr ><th>Parameters</th><th>Big Data</th><th>Type Curves</th></tr> |
<tr><td>Proppant number</td><td>14.8</td><td>14.8</td></tr> | <tr><td>Proppant number</td><td>14.8</td><td>14.8</td></tr> | ||
<tr><td>Dimensionless productivity index, JD</td><td>18.1</td><td>46.7</td></tr> | <tr><td>Dimensionless productivity index, JD</td><td>18.1</td><td>46.7</td></tr> | ||
| Line 82: | Line 85: | ||
The Bakken Big Data study on the area compiled by the company petroleum engineers suggests an optimum completion design being 30 stages with 10 clusters per stage. Based on working experience, engineers estimate to get about 200 fractures as a result of the well stimulation. | The Bakken Big Data study on the area compiled by the company petroleum engineers suggests an optimum completion design being 30 stages with 10 clusters per stage. Based on working experience, engineers estimate to get about 200 fractures as a result of the well stimulation. | ||
| − | Design agrees with the established within the company design practice of increasing the reservoir contact | + | Design agrees with the established within the company design practice of increasing the reservoir contact by adding more fractures to increase the oil rate. |
| − | === Optimized fracturing design - optiFracMS=== | + | === Optimized fracturing design - Type Curves and optiFracMS=== |
| − | [[File:Bakken Fracturing Optimization Case Study.png| optiFracMS software fracturing optimization screenshot ]] | + | [[File:Bakken Fracturing Optimization Case Study.png|link=https://www.pengtools.com/optiFracMS?paramsToken=dfd313493bfb0afb59dba9b6a3e7226a| optiFracMS software fracturing optimization screenshot ]] |
| − | [[:Category:optiFracMS | optiFracMS]] online petroleum engineering software at [https://www.pengtools.com www.pengtools.com] was run to optimize the fracture design. | + | [[:Category:optiFracMS | optiFracMS]] online petroleum engineering software at [https://www.pengtools.com www.pengtools.com] was run to optimize the fracture design<ref name = optifracMS/>. |
The resulted design calculates the optimum number of fractures to be 28. | The resulted design calculates the optimum number of fractures to be 28. | ||
Note that [[:Category:optiFracMS | optiFracMS]] was also used to calculate the design parameters (JD, CfD, xf, wf, Ix) of the Big Data design based on number of fractures of 200. | Note that [[:Category:optiFracMS | optiFracMS]] was also used to calculate the design parameters (JD, CfD, xf, wf, Ix) of the Big Data design based on number of fractures of 200. | ||
| + | |||
| + | The model of the case study is available for review online at [https://www.pengtools.com/optiFracMS?paramsToken=dfd313493bfb0afb59dba9b6a3e7226a www.pengtools.com]. | ||
==Hydraulic Fracturing Production Forecast== | ==Hydraulic Fracturing Production Forecast== | ||
| Line 103: | Line 108: | ||
</table> | </table> | ||
| − | + | ===Bakken oil rate fracturing forecast=== | |
| − | + | [[File:Bakken oil rate fracturing forecast.png|500px| Bakken oil rate fracturing forecast]] | |
| − | + | ||
| − | + | ===Bakken cumulative oil rate fracturing forecast=== | |
| − | + | [[File:Bakken cum oil rate fracturing forecast.png|500px| Bakken cumulative oil rate fracturing forecast]] | |
| − | |||
==Bakken Case Study Discussion and Conclusions== | ==Bakken Case Study Discussion and Conclusions== | ||
| + | ===The main conclusion=== | ||
| + | '''Optimized fracture design case predicts 61% more cumulative oil in the first year of well production.''' | ||
| − | + | ===Discussion=== | |
| − | |||
| − | |||
| − | |||
* The number of fractures was optimized from 200 to 28, which resulted in increase of the fractures half lengths from 64 to 455 ft, which increased the reservoir stimulation area and recovery. | * The number of fractures was optimized from 200 to 28, which resulted in increase of the fractures half lengths from 64 to 455 ft, which increased the reservoir stimulation area and recovery. | ||
* The Big data case produces high conductivity fractures (CfD =60 vs 8) with short fracture half lengths (xf = 64 vs 455 ft). This results in high initial rate which is rapidly declines due to lack of the reservoir contact area. The fracture underperforms. | * The Big data case produces high conductivity fractures (CfD =60 vs 8) with short fracture half lengths (xf = 64 vs 455 ft). This results in high initial rate which is rapidly declines due to lack of the reservoir contact area. The fracture underperforms. | ||
| − | * Make sure that technical optimum performance data is represented in your Big Data. Otherwise care should be taken when applying the Big Data. If the data range is represented with the poor performance data only, the result will | + | * Make sure that technical optimum performance data is represented in your Big Data range. Otherwise care should be taken when applying the Big Data. If the data range is represented with the poor performance data only, the result will be the poor performance average. |
== References == | == References == | ||
| Line 135: | Line 138: | ||
|date=December 2011 | |date=December 2011 | ||
|url=https://www.onepetro.org/journal-paper/SPE-125043-PA | |url=https://www.onepetro.org/journal-paper/SPE-125043-PA | ||
| + | |url-access=registration | ||
| + | }}</ref> | ||
| + | |||
| + | <references> | ||
| + | <ref name= optifracMS>{{cite journal | ||
| + | |last1=Guk|first1=Vyacheslav | ||
| + | |last2=Tuzovskiy|first2=Mikhail | ||
| + | |last3=Wolcott|first3=Don | ||
| + | |last4=Mach|first4=Joe | ||
| + | |title=Optimizing Number of Fractures in Horizontal Well | ||
| + | |publisher=Society of Petroleum Engineers | ||
| + | |journal=SPE Journal | ||
| + | |volume=24 | ||
| + | |issue=03 | ||
| + | |date=June 2019 | ||
| + | |url=https://www.onepetro.org/journal-paper/SPE-174772-PA | ||
|url-access=registration | |url-access=registration | ||
}}</ref> | }}</ref> | ||
Latest revision as of 18:04, 19 September 2023
Contents
Hydraulic Fracturing Design Optimization - Bakken Case Study

The case study is prepared to illustrate the unified approach to optimize the design of multiple transverse fractures in a horizontal well using the optiFracMS software.
The goal of the study is to optimize a fracturing design for a Bakken formation.
Two fracture design cases were considered:
- Operating company fracture design based on a Big Data application
- Optimized fracturing design based on the Type Curves
For the both cases a production forecast was calculated and cumulative oil production was compared.
Optimized fracture design case predicts 61% more cumulative oil in the first year of well production.
Inputs
The following inputs are used in both fracture design cases.
Fracturing Design Parameters |
Fracture Production Forecast Parameters | ||||||||||||||||||||||||||||||||||||||||||||||||||||||||||||||||||||
|
|
Hydraulic Fracturing Design Cases
| Parameters | Big Data | Type Curves |
|---|---|---|
| Proppant number | 14.8 | 14.8 |
| Dimensionless productivity index, JD | 18.1 | 46.7 |
| Number of fractures, n | 200 | 28 |
| Dimensionless fracture conductivity, CfD | 60 | 8 |
| Fracture half length, xf, ft | 64 | 455 |
| Fracture width, wf, in | 0.032 | 0.032 |
| Fracture penetration, Ix | 0.1 | 0.7 |
Operating company design - Big Data
The Bakken Big Data study on the area compiled by the company petroleum engineers suggests an optimum completion design being 30 stages with 10 clusters per stage. Based on working experience, engineers estimate to get about 200 fractures as a result of the well stimulation.
Design agrees with the established within the company design practice of increasing the reservoir contact by adding more fractures to increase the oil rate.
Optimized fracturing design - Type Curves and optiFracMS
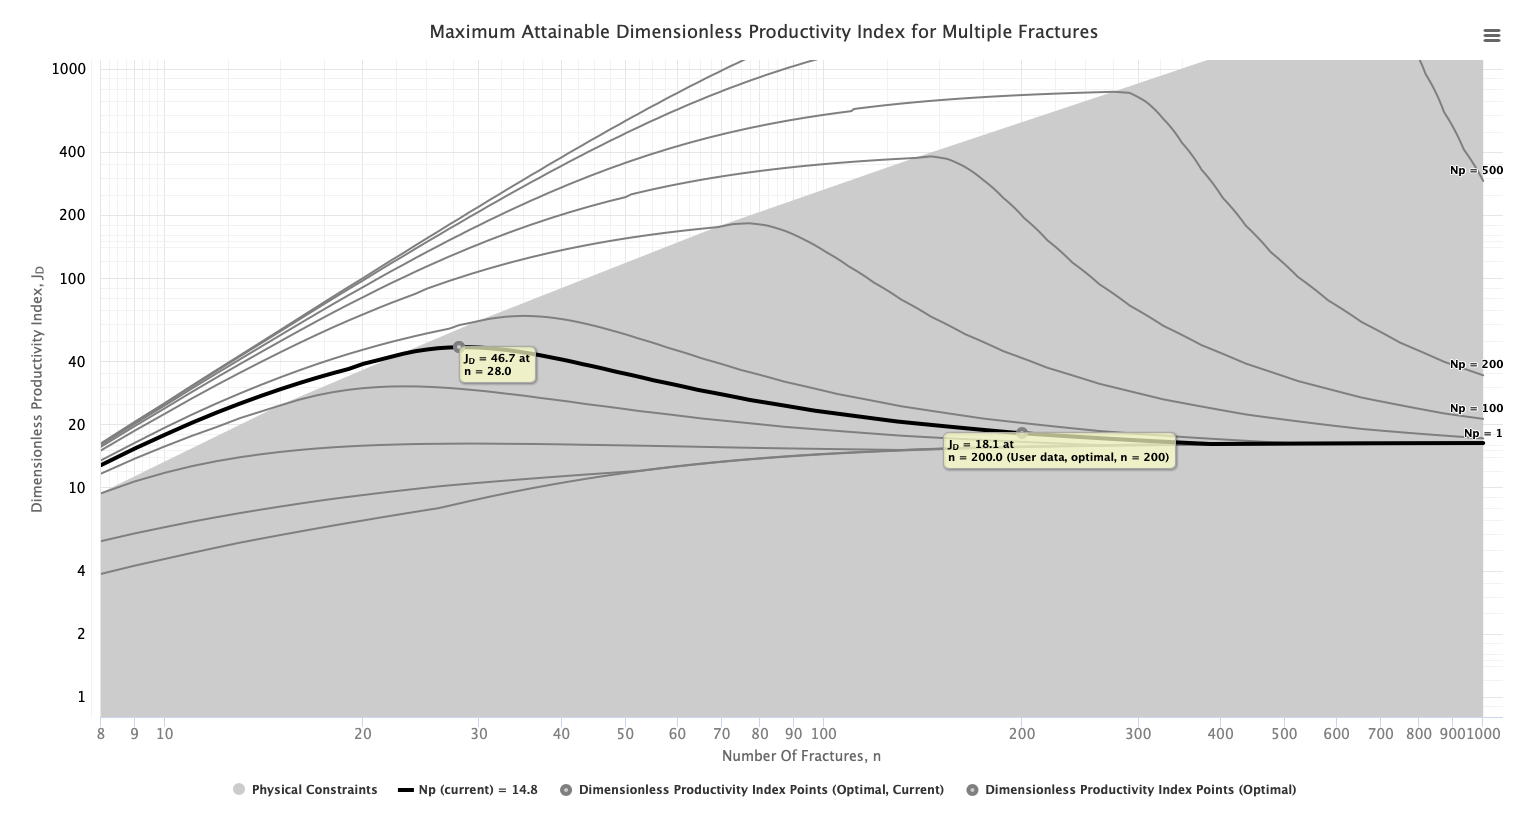
optiFracMS online petroleum engineering software at www.pengtools.com was run to optimize the fracture design[1].
The resulted design calculates the optimum number of fractures to be 28.
Note that optiFracMS was also used to calculate the design parameters (JD, CfD, xf, wf, Ix) of the Big Data design based on number of fractures of 200.
The model of the case study is available for review online at www.pengtools.com.
Hydraulic Fracturing Production Forecast
Both cases were simulated using the analytical model by Brown et al. [2] using the commercial software IHS Harmony.
1 year production forecasts were compared as a result:
| Parameters | Big Data | optiFracMS |
|---|---|---|
| Cumulative oil production in 1 year, Mstb | 70 | 113 |
Bakken oil rate fracturing forecast

Bakken cumulative oil rate fracturing forecast

Bakken Case Study Discussion and Conclusions
The main conclusion
Optimized fracture design case predicts 61% more cumulative oil in the first year of well production.
Discussion
- The number of fractures was optimized from 200 to 28, which resulted in increase of the fractures half lengths from 64 to 455 ft, which increased the reservoir stimulation area and recovery.
- The Big data case produces high conductivity fractures (CfD =60 vs 8) with short fracture half lengths (xf = 64 vs 455 ft). This results in high initial rate which is rapidly declines due to lack of the reservoir contact area. The fracture underperforms.
- Make sure that technical optimum performance data is represented in your Big Data range. Otherwise care should be taken when applying the Big Data. If the data range is represented with the poor performance data only, the result will be the poor performance average.
References
- ↑ Guk, Vyacheslav; Tuzovskiy, Mikhail; Wolcott, Don; Mach, Joe (June 2019). "Optimizing Number of Fractures in Horizontal Well"
 . SPE Journal. Society of Petroleum Engineers. 24 (03).
- ↑ Brown, Margaret; Ozkan, Erdal; Raghavan, Rajagopal; Kazemi, Hossein (December 2011). "Practical Solutions for Pressure-Transient Responses of Fractured Horizontal Wells in Unconventional Shale Reservoirs". SPE Reservoir Evaluation & Engineering. Society of Petroleum Engineers. 24 (06).