OnPlan Comparison Study 2 Warpinski
Contents
Brief
The case study is based on Warpinski [1] paper published in 1994.
The onPlan calculates 6 cases described in the paper and shows good agreement in results.
Inputs
Paper Summary
This study is a comparison of hydraulic fracture models run using test data from the GRI Staged Field Experiment No. 3. Models compared include 2D, pseudo-3D, and 3D codes, run on up to eight different cases. Documented in this comparison are the differences in length, height, width, pressure, and efficiency. The purpose of this study is to provide the completions engineer with a practical comparison of the available models so that rational decisions can be made as to which model is optimal for a given application.— Warpinski et al [1]
Simulators
Planar 3D models:
- TerraFrac of TerraTek Inc.
- HYFRAC3D by S.H. Advani of Lehigh U. - Planar 3D model
- GOHFER by by Marathon Oil Co. - a unique finite-difference simulator
Planar pseudo-3D models:
- STIMPLAN of NSI Inc.
- ENERFRAC of Shell
- TRIFRAC of S.A. Holditch & Assocs. Inc.
- FRACPRO of Reservoir Engineering Systems (RES) Inc.
- MFRAC-II of Meyer& Assocs.
Classic Perkins-Kern-Nordgren (PKN) and Geertsma-deKlerk (GDK) model:
- PROP of Halliburton
- Chevron 2D model
- Conoco 2D model
- Shell 2D model
- pseudo-3D models run in constant-height mode
Cases
| CASE | 1 | 2 | 3 | 4 | 5 | 6 |
|---|---|---|---|---|---|---|
| Formation Properties | ||||||
| Resesvoir and rock data | Single-Layer | Single-Layer | 3-Layer | 3-Layer | 5-Layer | 5-Layer |
| Fluid Properties | ||||||
| Viscosity, cP | 200 | 200 | 200 | |||
| K, (lbf-sec^n)/ft^2 | 0.06 | 0.06 | 0.06 | |||
| n | 0.5 | 0.5 | 0.5 | |||
| Leak-off, ft/min^0.5 | 0.00025 | 0.00025 | 0.00025 | 0.00025 | 0.00025 | 0.00025 |
| Spurt loss, gal/ft^2 | 0 | 0 | 0 | 0 | 0 | 0 |
| Other Data | ||||||
| Pumping rate, bbl/min | 50 | 50 | 50 | 50 | 50 | 50 |
| Pumping volume, bbl | 10000 | 10000 | 10000 | 10000 | 10000 | 10000 |
| Pupming time, min | 200 | 200 | 200 | 200 | 200 | 200 |
| Proppant | None | None | None | None | None | None |
Rock and reservoir data:
| Interval | Depth (ft) | Zone Thickness (ft) | In Situ Stress (psi) | Poisson's Ratio | Young's Modulus (10^6 psi) | Fracture Toughness (psi/in^0.5) |
|---|---|---|---|---|---|---|
| Single-Layer Case | ||||||
| 1 | 9170-9340 | 170 | 5700 | 0.21 | 8.5 | 2000 |
| 3-Layer Case | ||||||
| 1 | 8990-9170 | 180 | 7150 | 0.3 | 6.5 | 2000 |
| 2 | 9170-9340 | 170 | 5700 | 0.21 | 8.5 | 2000 |
| 3 | 9340-9650 | 310 | 7350 | 0.29 | 5.5 | 2000 |
| 5-Layer Case | ||||||
| 1 | 8990-9170 | 180 | 7150 | 0.3 | 6.5 | 2000 |
| 2 | 9170-9340 | 170 | 5700 | 0.21 | 8.5 | 2000 |
| 3 | 9340-9380 | 40 | 7350 | 0.26 | 5.4 | 2000 |
| 4 | 9380-9455 | 75 | 5800 | 0.2 | 7.9 | 2000 |
| 5 | 9455-9650 | 195 | 8200 | 0.3 | 4.0 | 2000 |
Perforations data:
The well was perforated between 9225 to 9250 ft and 9285 to 9330 ft.
Comparison
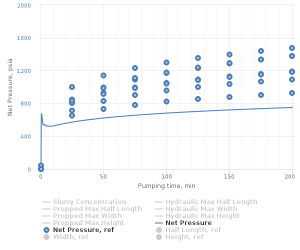
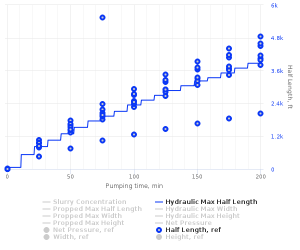
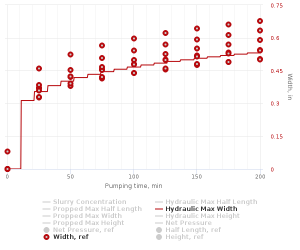
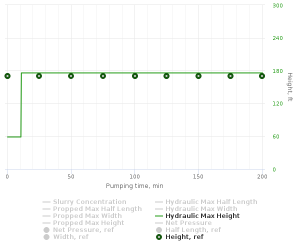
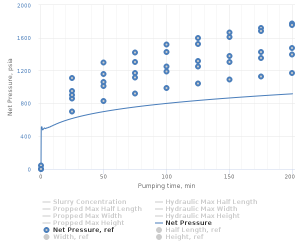
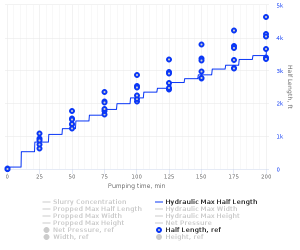
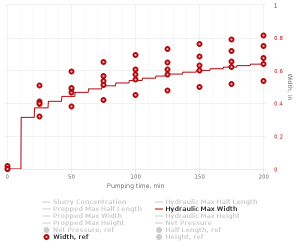
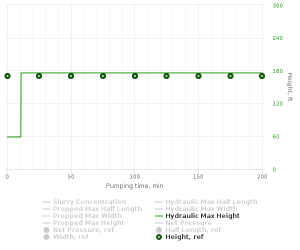
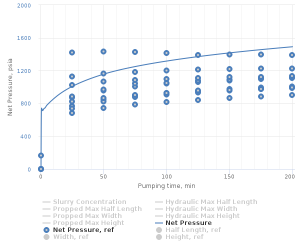
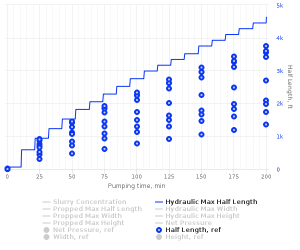
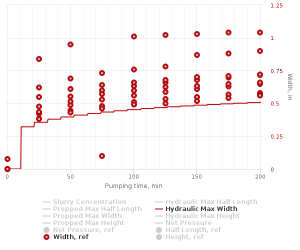
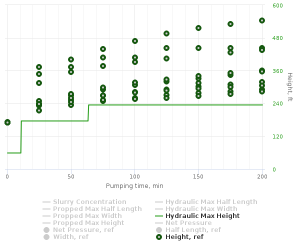
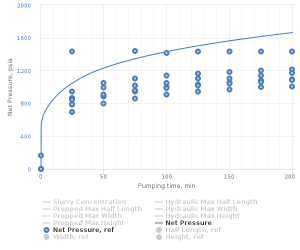
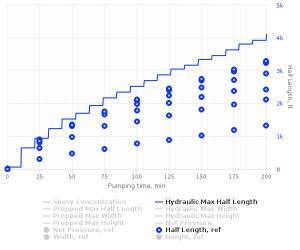
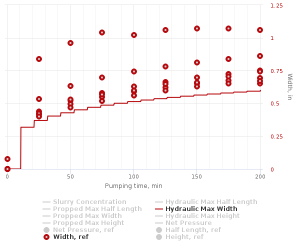
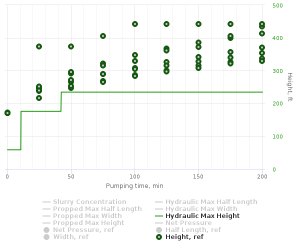
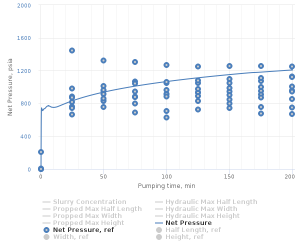
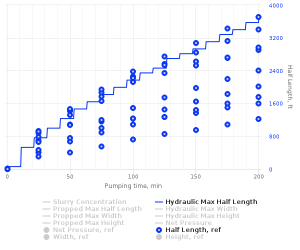
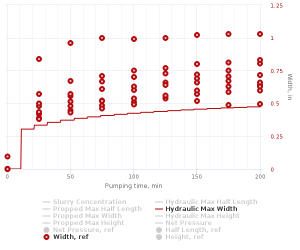
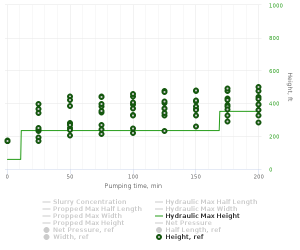
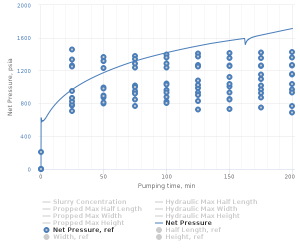
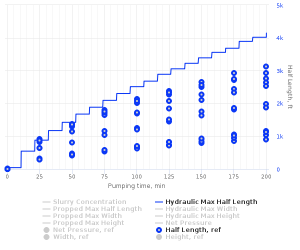
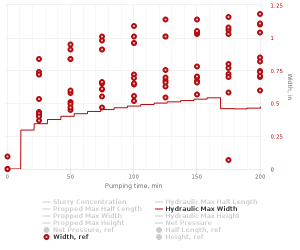
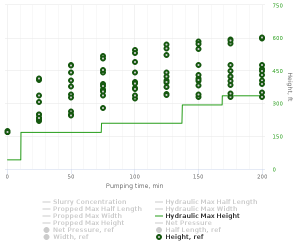
The fracture net pressure, half-length, width and height predicted by different simulators[1] are plotted below in dots. The overlapped onPlan fracture net pressure, half-length, width and height shown as lines.
Single-Layer cases 1 and 2 show good agreement between onPlan and paper results.
3-Layer and 5-Layer cases 3 - 6 show that onPlan generally predicts less height thus more length and less width.
These comparisons show that differences in calculated fracture lengths can be large, as much as a factor of three difference. Fracture heights, for the multi-layer cases, can differ by more than 50%. Net pressures also differ by a factor of two.— Warpinski et al [1]
onPlan Hydraulic Fracturing Models
The onPlan models from this study are available online at www.pengtools.com by the following links:
 Warpinski Case 1 (Single-Layer 200cp)
 Warpinski Case 2 (Single-Layer K&n)
 Warpinski Case 3 (3-Layer 200cp)
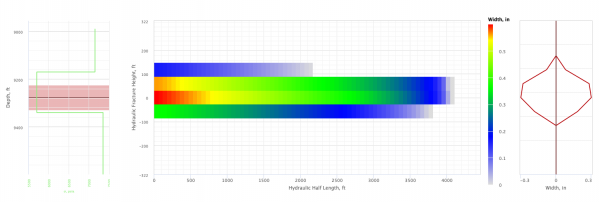 Warpinski Case 4 (3-Layer K&n)
 Warpinski Case 5 (5-Layer 200cp)
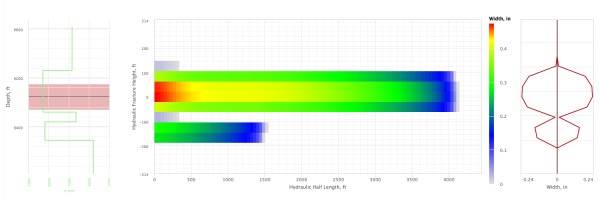 Warpinski Case 6 (5-Layer K&n)
Note that evaluation access is required to open the models. Please contact us to get evaluation access.
References
- ↑ 1.0 1.1 1.2 1.3 N.R., Warpinski; Z.A., Moschovidis; C.D., Parker; I.S., Abou-Sayed (1994). "Comparison Study of Hydraulic Fracturing Models—Test Case: GRI Staged Field Experiment No. 3 (includes associated paper 28158 )" (SPE-25890-PA). Society of Petroleum Engineers.
