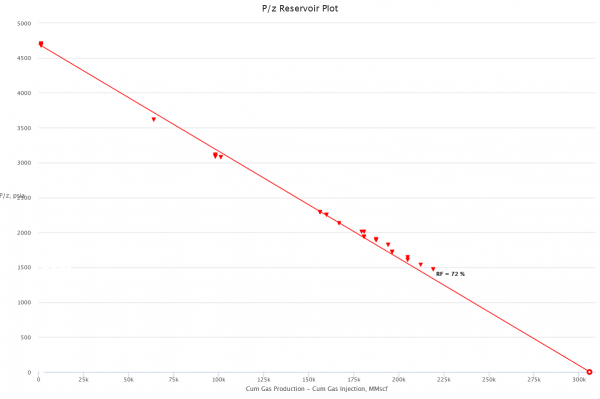
P/Z plot
Brief
The P/Z plot is a plot of P/z versus cumulative gas production, Gp.
The interpretation technique is fitting the data points with the straight line to estimate GIIP.
The P/Z plot is based on the Gas Material Balance equation.
Math & Physics
Applying Real Gas EOS at reservoir conditions:
 (1)
(1)
Applying Real Gas EOS at standard conditions:
 (2)
(2)
Dividing eq. 2 by eq. 1 and rearranging:
 (3)
(3)
Applying eq. 3 for initial conditions and for any point in time:
Applying eq. 3 for any point in time:
Therefore at any time:
Or:
Thus a plot of P/z vs cumulative produced gas is a straight line intersecting X axis at GIIP.
Discussion
P/Z plot is a part of the Reservoir Management workflow in the E&P Portal used to estimate Reservoirs GIIP and recovery.
Gas Flowing Material Balance is the more advanced tool to determine the Reservoirs GIIP and recovery as well as Well's EUR and JD.
Nomenclature
 = gas initially in place, scf
 = cumulative gas produced, scf
 = reservoir pressure (changing), psia
 = initial reservoir pressure (constant), psia
 = pressure at standard conditions, psia
 = initial reservoir pressure (constant), °R
 = reservoir pressure (constant), °R
 = temperature at standard conditions (constant), °R
 = volume of gas in reservoir converted to standard conditions (changing), scf
 = reservoir volume (constant), ft3
 = gas compressibility factor (changing), dimensionless
 = initial gas compressibility factor (constant), dimensionless


