Difference between revisions of "OnPlan Comparison Study 1 Weng"
(→Comparison results) |
(→Comparison results) |
||
| Line 42: | Line 42: | ||
==Comparison results== | ==Comparison results== | ||
| + | |||
| + | |||
| + | To illustrate the influence of different fluid flow models on frac- ture geometry, the fracture shapes predicted by different models at the end of pumping for Case B are plotted in Fig. 5. | ||
[[File:Weng Case B.png | Weng Case B]] | [[File:Weng Case B.png | Weng Case B]] | ||
Revision as of 11:27, 16 October 2018
Contents
Brief
The case study is based on Weng [1] paper published in 1992.
The onPlan calculates 12 cases described in the paper and shows reasonable agreement in results.
Inputs
Paper Summary
Pseudo 3D (P3D) hydraulic fracturing models often overpredict fracture height for a poorly contained fracture. This is caused partly by either the neglect of the fluid flow component in the vertical direction or a crude treatment of the 2D fluid flow in the fracture as 1D flow in the vertical direction in the fracture-height calculation. This paper presents a height-growth model that adopts a flow field more representative of the actual 2D flow in a fracture...— Xiaowei Weng[1]
Simulators
- Terra Tek 3D - fully 3D simulator
- U. of Texas 3D - fully 3D simulator
- Original P3D - a commercial P3D simulator
- Modified P3D - a commercial P3D simulator modified by replacing its original height-growth model with Weng 2D flow-height model
Cases
| CASE | A | B | C | D | E* | I | J | K | L | M | N | O |
|---|---|---|---|---|---|---|---|---|---|---|---|---|
| Formation Properties | ||||||||||||
| Young's modulus, psi | 4.225E+06 | 4.225E+06 | 4.225E+06 | 4.225E+06 | 4.225E+06 | 7.50E+05 | 7.50E+05 | 7.50E+05 | 7.50E+05 | 5.19E+06 | 5.19E+06 | 5.19E+06 |
| Poisson's ratio | 0.3 | 0.3 | 0.3 | 0.3 | 0.3 | 0.2 | 0.2 | 0.2 | 0.2 | 0.29 | 0.29 | 0.29 |
| Stress contrast, psi | 200 | 400 | 800 | 400 | 400 | 100 | 100 | 100 | 500 | 900, 1400 | 900, 1400 | 900, 1400 |
| Fracture toughness, psi in^0.5 | 1000 | 1000 | 1000 | 1000 | 1000 | 1000 | 1000 | 1000 | 1000 | 4920 | 4920 | 4920 |
| Fluid Properties | ||||||||||||
| K, (lbf-sec^n)/ft^2 | 0.0031 | 0.0031 | 0.0031 | 0.0016 | 0.0031 | 0.12 | 0.07 | 0.00002 | 0.07 | 0.00157 | 0.15 | 0.00002 |
| n | 1 | 1 | 1 | 1 | 1 | 0.39 | 0.75 | 1 | 0.75 | 1 | 0.4 | 1 |
| Leak-off, ft/min^0.5 | 0.0006 | 0.0006 | 0.0006 | 0.0006 | 0.0006 | 0.000163** | 0.000163** | 0.000163** | 0.000163** | 0.000043*** | 0.000043*** | 0.000043*** |
| Spurt loss, gal/ft^2 | 0 | 0 | 0 | 0 | 0 | 0.025 | 0.025 | 0.025 | 0.025 | 0.00035 | 0.00035 | 0.00035 |
| Other Data | ||||||||||||
| Pumping rate, bbl/min | 20 | 20 | 20 | 20 | 20 | 40 | 40 | 40 | 40 | 25 | 25 | 25 |
| Pumping volume, 1000 gal | 25 | 25 | 25 | 25 | 25 | 66 | 64 | 63 | 71 | 5.6 | 10 | 2.5 |
| Pupming time, min | 29.8 | 29.8 | 29.8 | 29.8 | 29.8 | 39.3 | 38.1 | 37.5 | 42.3 | 5.3 | 9.5 | 2.4 |
| Perforated interval, ft | 80 | 80 | 80 | 80 | 80 | 180 | 180 | 180 | 180 | 16.4 | 16.4 | 16.4 |
| Pay-zone thickness, ft | 100 | 100 | 100 | 100 | 100 | 223 | 223 | 223 | 223 | 62 | 62 | 62 |
* - Case E is identical to Case B, except there is no fluid leakoff in the bounding layers.
** - In case spurt-loss is not an input a larger leak-off coefficient of 0.00065 is used which yields roughly the same efficiency as the other models.
*** - In case spurt-loss is not an input a larger leak-off coefficient of 0.0002 is used which yields roughly the same efficiency as the other models.
Comparison results
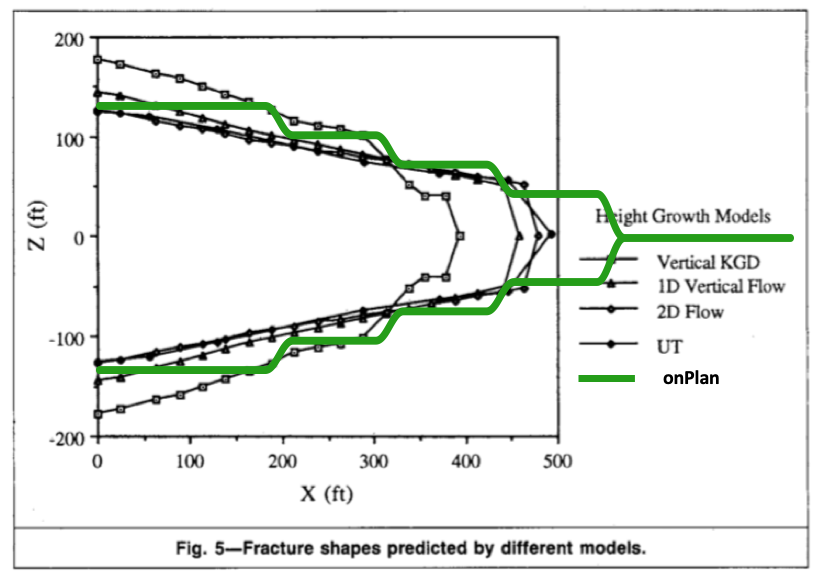
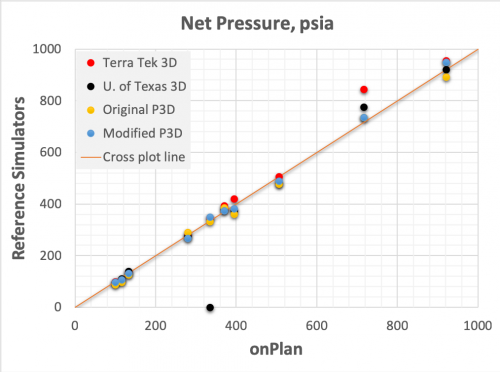
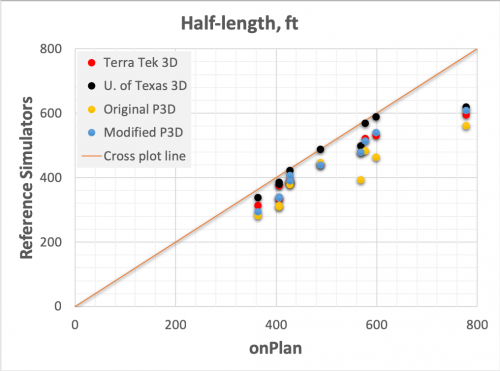
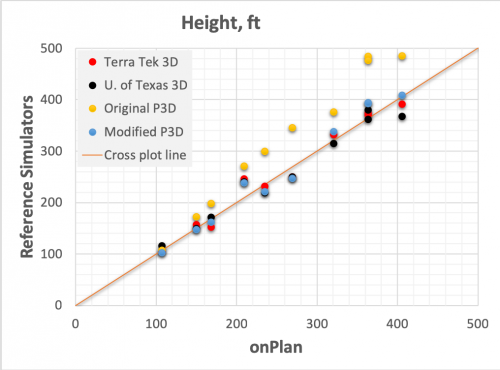
To illustrate the influence of different fluid flow models on frac- ture geometry, the fracture shapes predicted by different models at the end of pumping for Case B are plotted in Fig. 5.
 |  |
 | 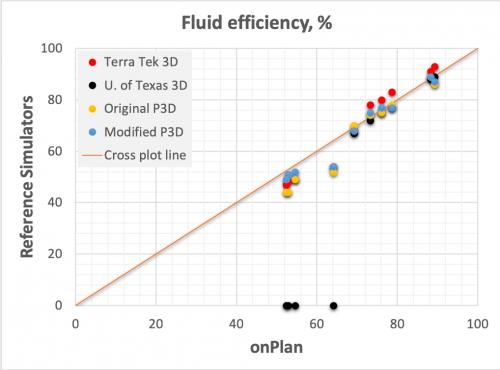 |
Summary Table
| Volume | Pressure | Half-Length | Height | Efficiency | ||
|---|---|---|---|---|---|---|
| Case | Model | (1,000 gal) | (psi) | (ft) | (ft) | % |
| A | Terra Tek | 25 | 280 | 335 | 371 | 48 |
| A | U. of Texas | 25 | 275 | 380 | 380 | — |
| A | Original P3D | 25 | 291 | 314 | 485 | 44 |
| A | Modified P3D | 25 | 268 | 340 | 393 | 51 |
| A | onPlan | 25 | 279.9 | 405.5 | 341.6 | 52.85 |
| B | Terra Tek | 25 | 420 | 479 | 250 | 49 |
| B | U. of Texas | 25 | 375 | 500 | 250 | — |
| B | Original P3D | 25 | 362 | 394 | 346 | 49 |
| B | Modified P3D | 25 | 382 | 479 | 247 | 52 |
| B | onPlan | 25 | 394.5 | 567.9 | 239.1 | 54.61 |
| C | Terra Tek | 25 | 506 | 596 | 157 | 54 |
| C | U. of Texas | 25 | 480 | 620 | 150 | — |
| C | Original P3D | 25 | 477 | 562 | 173 | 52 |
| C | Modified P3D | 25 | 489 | 610 | 148 | 54 |
| C | onPlan | 25 | 505.8 | 777.2 | 119.6 | 64.1 |
| D | Terra Tek | 25 | 348 | 532 | 232 | 47 |
| D | U. of Texas | 25 | — | 590 | 220 | — |
| D | Original P3D | 25 | 332 | 464 | 300 | 44 |
| D | Modified P3D | 25 | 350 | 540 | 222 | 49 |
| D | onPlan | 25 | 334.4 | 597.8 | 213.5 | 52.38 |
| E | Terra Tek | 25 | 393 | 523 | 333 | 68 |
| E | U. of Texas | 25 | 379 | 570 | 315 | 67 |
| E | Original P3D | 25 | 386 | 484 | 377 | 70 |
| E | Modified P3D | 25 | 375 | 515 | 338 | 68 |
| E | onPlan | 25 | 369.8 | 576.4 | 298.9 | 69.25 |
| I | Terra Tek | 66 | 100 | 375 | 375 | 78 |
| I | U. of Texas | 66 | 98 | 387 | 362 | 72 |
| I | Original P3D | 66 | 88 | 310 | 477 | 74 |
| I | Modified P3D | 66 | 98 | 337 | 395 | 75 |
| I | onPlan | 66 | 99.08 | 405.5 | 341.6 | 73.25 |
| J | Terra Tek | 64 | 109 | 314 | 392 | 80 |
| J | U. of Texas | 64 | 111 | 339 | 368 | 75 |
| J | Original P3D | 64 | 98 | 283 | 486 | 75 |
| J | Modified P3D | 64 | 108 | 295 | 409 | 77 |
| J | onPlan | 64 | 115.7 | 362.9 | 384.3 | 76.06 |
| K | Terra Tek | 63 | 34 | 806 | 252 | 62 |
| K | U. of Texas | — | — | — | — | — |
| K | Original P3D | 63 | 36 | 611 | 267 | 57 |
| K | Modified P3D | 63 | 29 | 810 | 231 | 50 |
| K | onPlan | — | — | — | — | — |
| L | Terra Tek | 71 | 137 | 390 | 246 | 83 |
| L | U. of Texas | 71 | 140 | 383 | 241 | 77 |
| L | Original P3D | 71 | 127 | 379 | 271 | 78 |
| L | Modified P3D | 71 | 133 | 391 | 239 | 77 |
| L | onPlan | 71 | 132.5 | 427.2 | 213.5 | 78.69 |
| M | Terra Tek | 5.6 | 845 | 393 | 105 | 93 |
| M | U. of Texas | 5.6 | 775 | 423 | 116 | 89 |
| M | Original P3D | 5.6 | 735 | 387 | 108 | 86 |
| M | Modified P3D | 5.6 | 736 | 408 | 103 | 87 |
| M | onPlan | 5.6 | 715.8 | 427.2 | 91.5 | 89.3 |
| N | Terra Tek | 10 | 955 | 442 | 153 | 91 |
| N | U. of Texas | 10 | 920 | 489 | 172 | 88 |
| N | Original P3D | 10 | 892 | 447 | 199 | 89 |
| N | Modified P3D | 10 | 950 | 440 | 162 | 89 |
| N | onPlan | 10 | 921 | 487.9 | 152.5 | 88.36 |
| O | Terra Tek | 2.5 | 423 | 376 | 81 | 92 |
| O | U. of Texas | — | — | — | — | — |
| O | Original P3D | 2.5 | 298 | 512 | 70 | 78 |
| O | Modified P3D | 2.5 | 318 | 444 | 66 | 78 |
| O | onPlan | — | — | — | — | — |
References
- ↑ 1.0 1.1 Weng, Xiaowei (1992). "Incorporation of 2D Fluid Flow Into a Pseudo-3D Hydraulic Fracturing Simulator" (SPE-21849-PA). Society of Petroleum Engineers.
