Difference between revisions of "P/Z plot"
(→Discussion) |
|||
| Line 34: | Line 34: | ||
== Discussion == | == Discussion == | ||
| − | [[P/Z | + | [[P/Z plot]] is a part of [[Reservoir Management]] workflow of the [[:Category:E&P Portal | E&P Portal]]. |
== Nomenclature == | == Nomenclature == | ||
Revision as of 10:48, 21 November 2017
Brief
The P/Z plot is a plot of P/z versus cumulative gas production, Gp.
The interpretation technique is fitting the data points with the straight line to estimate GIIP.
The P/Z plot is based on the Gas Material Balance equation.
Math & Physics
Applying Real Gas EOS at reservoir conditions:
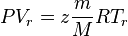 (1)
(1)
Applying Real Gas EOS at standard conditions:
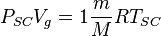 (2)
(2)
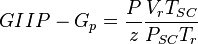
Dividing eq. 2 by eq. 1 and rearranging:
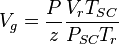 (3)
(3)
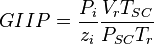
Applying eq. 3 for initial conditions and for any point in time:
Applying eq. 3 for any point in time:
Therefore at any time:
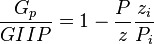
Or:
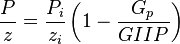
Thus a plot of P/z vs cumulative produced gas is a straight line intersecting X axis at GIIP.
Discussion
P/Z plot is a part of Reservoir Management workflow of the E&P Portal.
Nomenclature
 = gas initially in place, ft3
 = reservoir pressure (changing), psia
 = initial reservoir pressure (constant), psia
 = pressure at standard conditions, psia
 = initial reservoir pressure (constant), °R
 = reservoir pressure (constant), °R
 = temperature at standard conditions (constant), °R
 = volume of gas in reservoir converted to standard conditions (changing), ft3
 = reservoir volume (constant), ft3
 = gas compressibility factor (changing), dimensionless
References
Cite error: <ref> tag defined in <references> has group attribute "" which does not appear in prior text.
Cite error: <ref> tag defined in <references> has group attribute "" which does not appear in prior text.
Cite error: <ref> tag defined in <references> has group attribute "" which does not appear in prior text.