Difference between revisions of "Decline Curve Analysis"
From wiki.pengtools.com
(→Math & Physics) |
(→Math & Physics) |
||
| Line 22: | Line 22: | ||
<tr> | <tr> | ||
| − | <td> | + | <td>Exponential decline, b = 0</td> |
| − | <td> | + | <td><math>q(t) = {q_i}^{-D_i\ t}</math></td> |
| − | <td> | + | <td><math>q(t) = {q_i}^{-D_i\ t}</math></td> |
</tr> | </tr> | ||
Revision as of 15:34, 26 October 2017
Contents
Brief
Decline Curve Analysis DCA is an empirical method for rate decline analysis and rate forecasting published by Arps in 1945 [1].
DCA is applied for Wells and Reservoirs production forecasting.
Math & Physics
| Note | Rate | Cumulative |
|---|---|---|
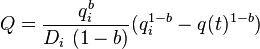
| General form equation [2] | 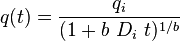 |
 |
| Exponential decline, b = 0 | 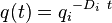 |
|
References
- ↑ Arps, J. J. (1945). "Analysis of Decline Curves"
 . Transactions of the AIME. Society of Petroleum Engineers. 160 (01).
- ↑ "KAPPA Dynamic Data Analysis (DDA) book".