Difference between revisions of "Category: PhaseD"
(→Phase Diagram Calulator) |
|||
| (4 intermediate revisions by the same user not shown) | |||
| Line 1: | Line 1: | ||
| − | == | + | ==Phase Diagram Calculator== |
[[File:PhaseD_i.png|thumb|300px|link=https://www.pengtools.com/phaseD|PhaseD]] | [[File:PhaseD_i.png|thumb|300px|link=https://www.pengtools.com/phaseD|PhaseD]] | ||
| − | [[:Category:PhaseD | PhaseD]] is a robust and simple to use | + | [[:Category:PhaseD | PhaseD]] is a robust and simple to use software in the [[:Category: Pengtools | pengtools]]. |
[[:Category:PhaseD | PhaseD]] builds a pressure-temperature phase diagram for the given gas compositions. | [[:Category:PhaseD | PhaseD]] builds a pressure-temperature phase diagram for the given gas compositions. | ||
| Line 38: | Line 38: | ||
{{#seo: | {{#seo: | ||
| − | |title=Phase Diagram | + | |title=Phase Diagram Petroleum Engineering Software |
|titlemode= replace | |titlemode= replace | ||
|keywords=phase diagram, phase change diagram, phase diagram database, natural gas composition analysis, critical point, molecular weigh, mole calculator, petroleum engineering | |keywords=phase diagram, phase change diagram, phase diagram database, natural gas composition analysis, critical point, molecular weigh, mole calculator, petroleum engineering | ||
| − | |description= | + | |description=phaseD is a petroleum engineering software which calculates a pressure-temperature phase diagram for the given gas composition. |
}} | }} | ||
Latest revision as of 09:30, 17 April 2019
Phase Diagram Calculator
PhaseD is a robust and simple to use software in the pengtools.
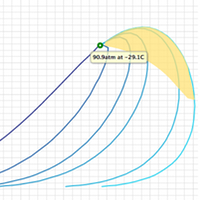
PhaseD builds a pressure-temperature phase diagram for the given gas compositions.
PhaseD highlights the two phases region and calculates quality lines of liquid-volume fractions, which indicate the fraction of total volume occupied by the liquid phase.
Flash tab allows to find the compositions of coexisting liquid and vapor phases under user defined temperature and pressure.
PhaseD is available online at www.pengtools.com.
Typical applications
- A pressure-temperature phase diagram for a multicomponent mixture
- Quality line of the liquid-volume fractions
- Retrograde condensate region
- Calculation of Cricondenbar, Cricondentherm and Critical point
- Calculation of main liquid and vapor properties under user defined temperature and pressure
- Capability to compare phase diagrams of the different compositions
- Flash calculations
- Components library (Symbol, Formula, Molecular weigh, Mole %, critical temperature, critical pressure, Acentric factor, Volume shift, critical z factor)
Main features
- "Default values" button resets input values to the default values.
- Switch between Metric and Field units.
- Save/load models to the files and to the user’s cloud.
- Export pdf report containing input parameters, calculated values and the chart.
- Share models to the public cloud or by using model’s link.
- Continue your work from where you stopped: last saved model will be automatically opened.
- Download the chart as an image or data and print (upper-right corner chart’s button).
- Export results table to Excel or other application.
References
Calculations are based on the two most common EOSs used in petroleum engineering applications: the Peng-Robinson and Soave-Redlich-Kwong equations. It should be mentioned that calculations using Soave-Redlich-Kwong EOS are quicker and results of the two methods are in agreement.

