Difference between revisions of "Decline Curve Analysis"
From wiki.pengtools.com
(→Math & Physics) |
|||
| (95 intermediate revisions by the same user not shown) | |||
| Line 2: | Line 2: | ||
==Brief== | ==Brief== | ||
| − | [[Decline Curve Analysis]] '''DCA''' is an empirical method for rate decline analysis and rate forecasting published by Arps in '''1945''' <ref name=Arps />. | + | |
| + | [[Decline Curve Analysis]] '''(DCA)''' is an empirical method for rate decline analysis and rate forecasting published by Arps in '''1945''' <ref name=Arps />. | ||
[[Decline Curve Analysis|DCA]] is applied for [[Well]]s and [[Reservoirs]] production forecasting. | [[Decline Curve Analysis|DCA]] is applied for [[Well]]s and [[Reservoirs]] production forecasting. | ||
| − | + | [[:Category:E&P Portal | E&P Portal ]] has [[Decline Curve Analysis| DCA]] available as one of it's engineering tools. | |
| − | |||
| − | |||
| − | |||
| + | [[File:DCA.gif|link=https://ep.pengtools.com/typecurve/oil-plot]] | ||
| + | <center>[[Decline Curve Analysis| DCA]] in the [https://ep.pengtools.com/typecurve/oil-plot E&P Portal]</center> | ||
| + | == Math & Physics == | ||
<table width="100%" border="1" cellpadding="3" cellspacing="1"> | <table width="100%" border="1" cellpadding="3" cellspacing="1"> | ||
<tr> | <tr> | ||
| − | <th>Note</th> | + | <th>Note <ref name = DDA /></th> |
<th>Rate</th> | <th>Rate</th> | ||
<th>Cumulative</th> | <th>Cumulative</th> | ||
| Line 21: | Line 22: | ||
<tr> | <tr> | ||
| − | <td> | + | <td>Hyperbolic decline<BR> 0 < b < 1, b > 1</td> |
| − | <td> | + | <td><math>q(t) = \frac{q_i}{(1+b\ D_i\ t)^{1/b}}</math></td> |
| − | <td> | + | <td><math> Q = \frac{q_i}{D_i\ (b-1)} \left ( (1+b\ D_i\ t)^ \left ( 1-\frac{1}{b} \right ) -1 \right )</math></td> |
| + | </tr> | ||
| + | |||
| + | <tr> | ||
| + | <td>Exponential decline<BR>b = 0</td> | ||
| + | <td><math>q(t) = {q_i}\ e^{-D_i\ t}</math></td> | ||
| + | <td><math>Q = \frac{q_i}{D_i}(1-e^{-D_i\ t})</math></td> | ||
</tr> | </tr> | ||
<tr> | <tr> | ||
| − | <td> | + | <td>Harmonic decline<BR> b = 1</td> |
| − | <td> | + | <td><math>q(t) = \frac{q_i}{1+D_i\ t}</math></td> |
| − | <td> | + | <td><math>Q = \frac{q_i}{D_i} ln{(1+D_i\ t)}</math></td> |
</tr> | </tr> | ||
</table> | </table> | ||
| + | |||
| + | == Discussion == | ||
| + | If one has a need to convert decline factor D<sub>i</sub> to the actual annual decline in %: | ||
| + | |||
| + | :<math>if\ b > 0, a = (1 - (1 + b\ D_i)^{- 1 / b}) \times 100 </math> | ||
| + | |||
| + | :<math>if\ b = 0, a = (1 - e^{-D_i}) \times 100</math> | ||
| + | |||
| + | == Workflow == | ||
| + | # Upload the data required | ||
| + | # Open the [[Decline Curve Analysis| DCA]] tool [https://ep.pengtools.com/typecurve/oil-plot here] | ||
| + | # For a single well | ||
| + | ##Select a well in a filter | ||
| + | ##Input the initial rate, <math>q_i</math> | ||
| + | ##Drag the Navigation Point to match the actual data | ||
| + | ##Correct the model parameters manually if needed | ||
| + | ##Check the difference in cumulative production of actual cure vs decline curve | ||
| + | ##Check the Rate vs Cumulaive Plot in linear and log scale | ||
| + | ##Save the decline curve model | ||
| + | ##Move to the next well | ||
| + | #For a multiple wells | ||
| + | ##Select the wells in the filter | ||
| + | ##[[Decline Curve Analysis| DCA]] tool will automatically normalize the wells data to zero time and then averages it | ||
| + | ##Input the initial rate, <math>q_i</math> | ||
| + | ##Drag the Navigation Point to match the actual data | ||
| + | ##Correct the model parameters manually if needed | ||
| + | ##Check the difference in cumulative production of average cure vs decline curve | ||
| + | ##Check the Rate vs Cumulaive Plot in linear and log scale | ||
| + | ##Export the type curve if needed | ||
| + | |||
| + | [[File:DCA for multiple wells.png|thumb|center|600px|link=https://ep.pengtools.com/typecurve/oil-plot | DCA tool at the E&P Portal]] | ||
| + | |||
| + | === Data required === | ||
| + | * Create [[Field]] [https://ep.pengtools.com/field/index here] | ||
| + | * [[Upload Wells]] | ||
| + | * [[Upload Daily Measures]] | ||
| + | |||
| + | === Nomenclature === | ||
| + | :<math> a </math> = annual decline, % | ||
| + | :<math> b </math> = decline curve parametr, dimensionless | ||
| + | :<math> D_i </math> = decline factor per time t, dimensionless | ||
| + | :<math> q_i </math> = initial rate, any rate units applies | ||
| + | :<math> q(t) </math> = rate at time t, any rate units applies | ||
| + | :<math> Q </math> = cumulatve rate at time t, any rate units applies | ||
| + | :<math> t </math> = forecast time, days | ||
== References == | == References == | ||
| Line 53: | Line 105: | ||
|title=KAPPA Dynamic Data Analysis (DDA) book | |title=KAPPA Dynamic Data Analysis (DDA) book | ||
|url=https://www.kappaeng.com/downloads/ddabook | |url=https://www.kappaeng.com/downloads/ddabook | ||
| − | |||
}}</ref> | }}</ref> | ||
</references> | </references> | ||
[[Category:E&P Portal]] | [[Category:E&P Portal]] | ||
| + | |||
| + | {{#seo: | ||
| + | |title=Decline Curve Analysis | ||
| + | |titlemode= replace | ||
| + | |keywords=DCA, harmonic decline curve, Decline Curve Analysis, hyperbolic decline curve, exponential decline curve, Arps JJ | ||
| + | |description=Decline Curve Analysis is an empirical method for rate decline analysis and rate forecasting forecasting published by Arps in 1945. | ||
| + | }} | ||
Latest revision as of 09:06, 6 December 2018
Contents
Brief
Decline Curve Analysis (DCA) is an empirical method for rate decline analysis and rate forecasting published by Arps in 1945 [1].
DCA is applied for Wells and Reservoirs production forecasting.
E&P Portal has DCA available as one of it's engineering tools.
Math & Physics
| Note [2] | Rate | Cumulative |
|---|---|---|
| Hyperbolic decline 0 < b < 1, b > 1 |
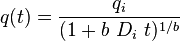 |
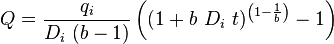 |
| Exponential decline b = 0 |
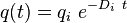 |
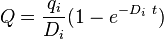 |
| Harmonic decline b = 1 |
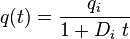 |
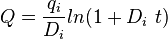 |
Discussion
If one has a need to convert decline factor Di to the actual annual decline in %:


Workflow
- Upload the data required
- Open the DCA tool here
- For a single well
- Select a well in a filter
- Input the initial rate,

- Drag the Navigation Point to match the actual data
- Correct the model parameters manually if needed
- Check the difference in cumulative production of actual cure vs decline curve
- Check the Rate vs Cumulaive Plot in linear and log scale
- Save the decline curve model
- Move to the next well
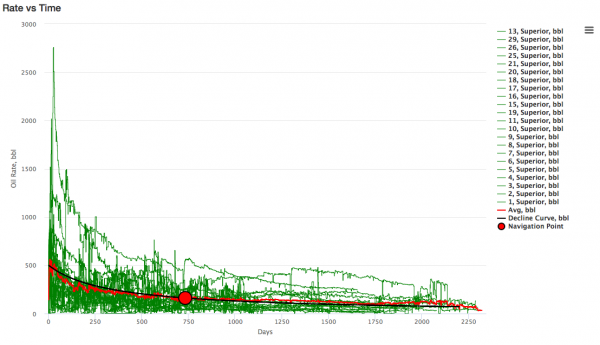
- For a multiple wells
- Select the wells in the filter
- DCA tool will automatically normalize the wells data to zero time and then averages it
- Input the initial rate,
- Drag the Navigation Point to match the actual data
- Correct the model parameters manually if needed
- Check the difference in cumulative production of average cure vs decline curve
- Check the Rate vs Cumulaive Plot in linear and log scale
- Export the type curve if needed
Data required
Nomenclature
 = annual decline, %
 = decline curve parametr, dimensionless
 = decline factor per time t, dimensionless
- = initial rate, any rate units applies
 = rate at time t, any rate units applies
 = cumulatve rate at time t, any rate units applies
 = forecast time, days
References
- ↑ Arps, J. J. (1945). "Analysis of Decline Curves"
 . Transactions of the AIME. Society of Petroleum Engineers. 160 (01).
- ↑ "KAPPA Dynamic Data Analysis (DDA) book".