File list
This special page shows all uploaded files.
First page |
Previous page |
Next page |
Last page |
| Date | Name | Thumbnail | Size | Description | Versions |
|---|---|---|---|---|---|
| 13:32, 31 July 2018 | Enhancement Tracking CaseStudy.pdf (file) | 9.51 MB | This Case Study demonstrates the application of the Enhancement Tracking workflow using the E&P Portal. The Study is based on the enhancement campaign implemented in an oil field located in Siberia, Russia. The campaign included such Enhancements as f... | 1 | |
| 13:19, 18 April 2018 | OilFMB CaseStudy.pdf (file) | 7.96 MB | Oil FMB case study | 1 | |
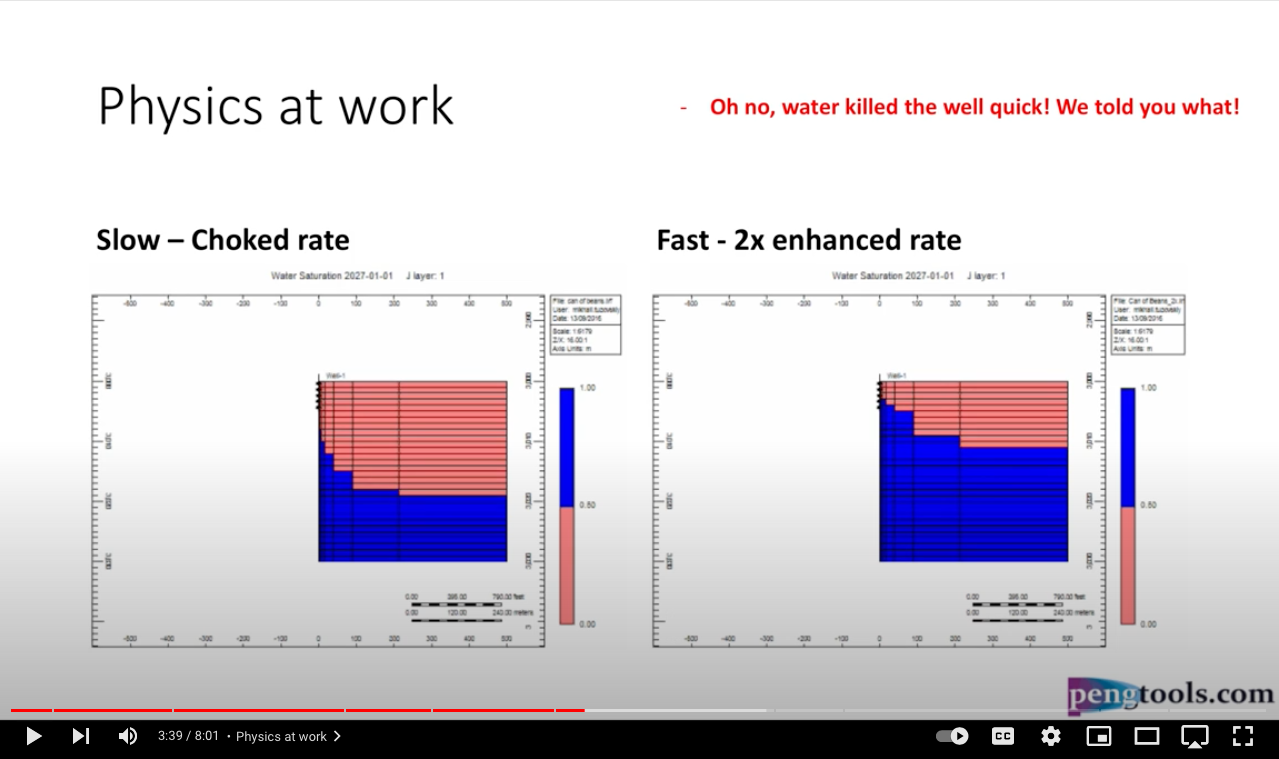
| 07:34, 12 December 2022 | Can of beans Water Saturation slow.gif (file) |  |
2.1 MB | Can_of_beans_Water_Saturation_slow | 1 |
| 07:38, 12 December 2022 | Can of beans Water Saturation fast.gif (file) |  |
1.7 MB | Can_of_beans_Water_Saturation_fast | 1 |
| 09:48, 23 August 2018 | Hagedorn and Brown ppt.pdf (file) | 1.47 MB | Hagedorn and Brown correlation overview presentation | 1 | |
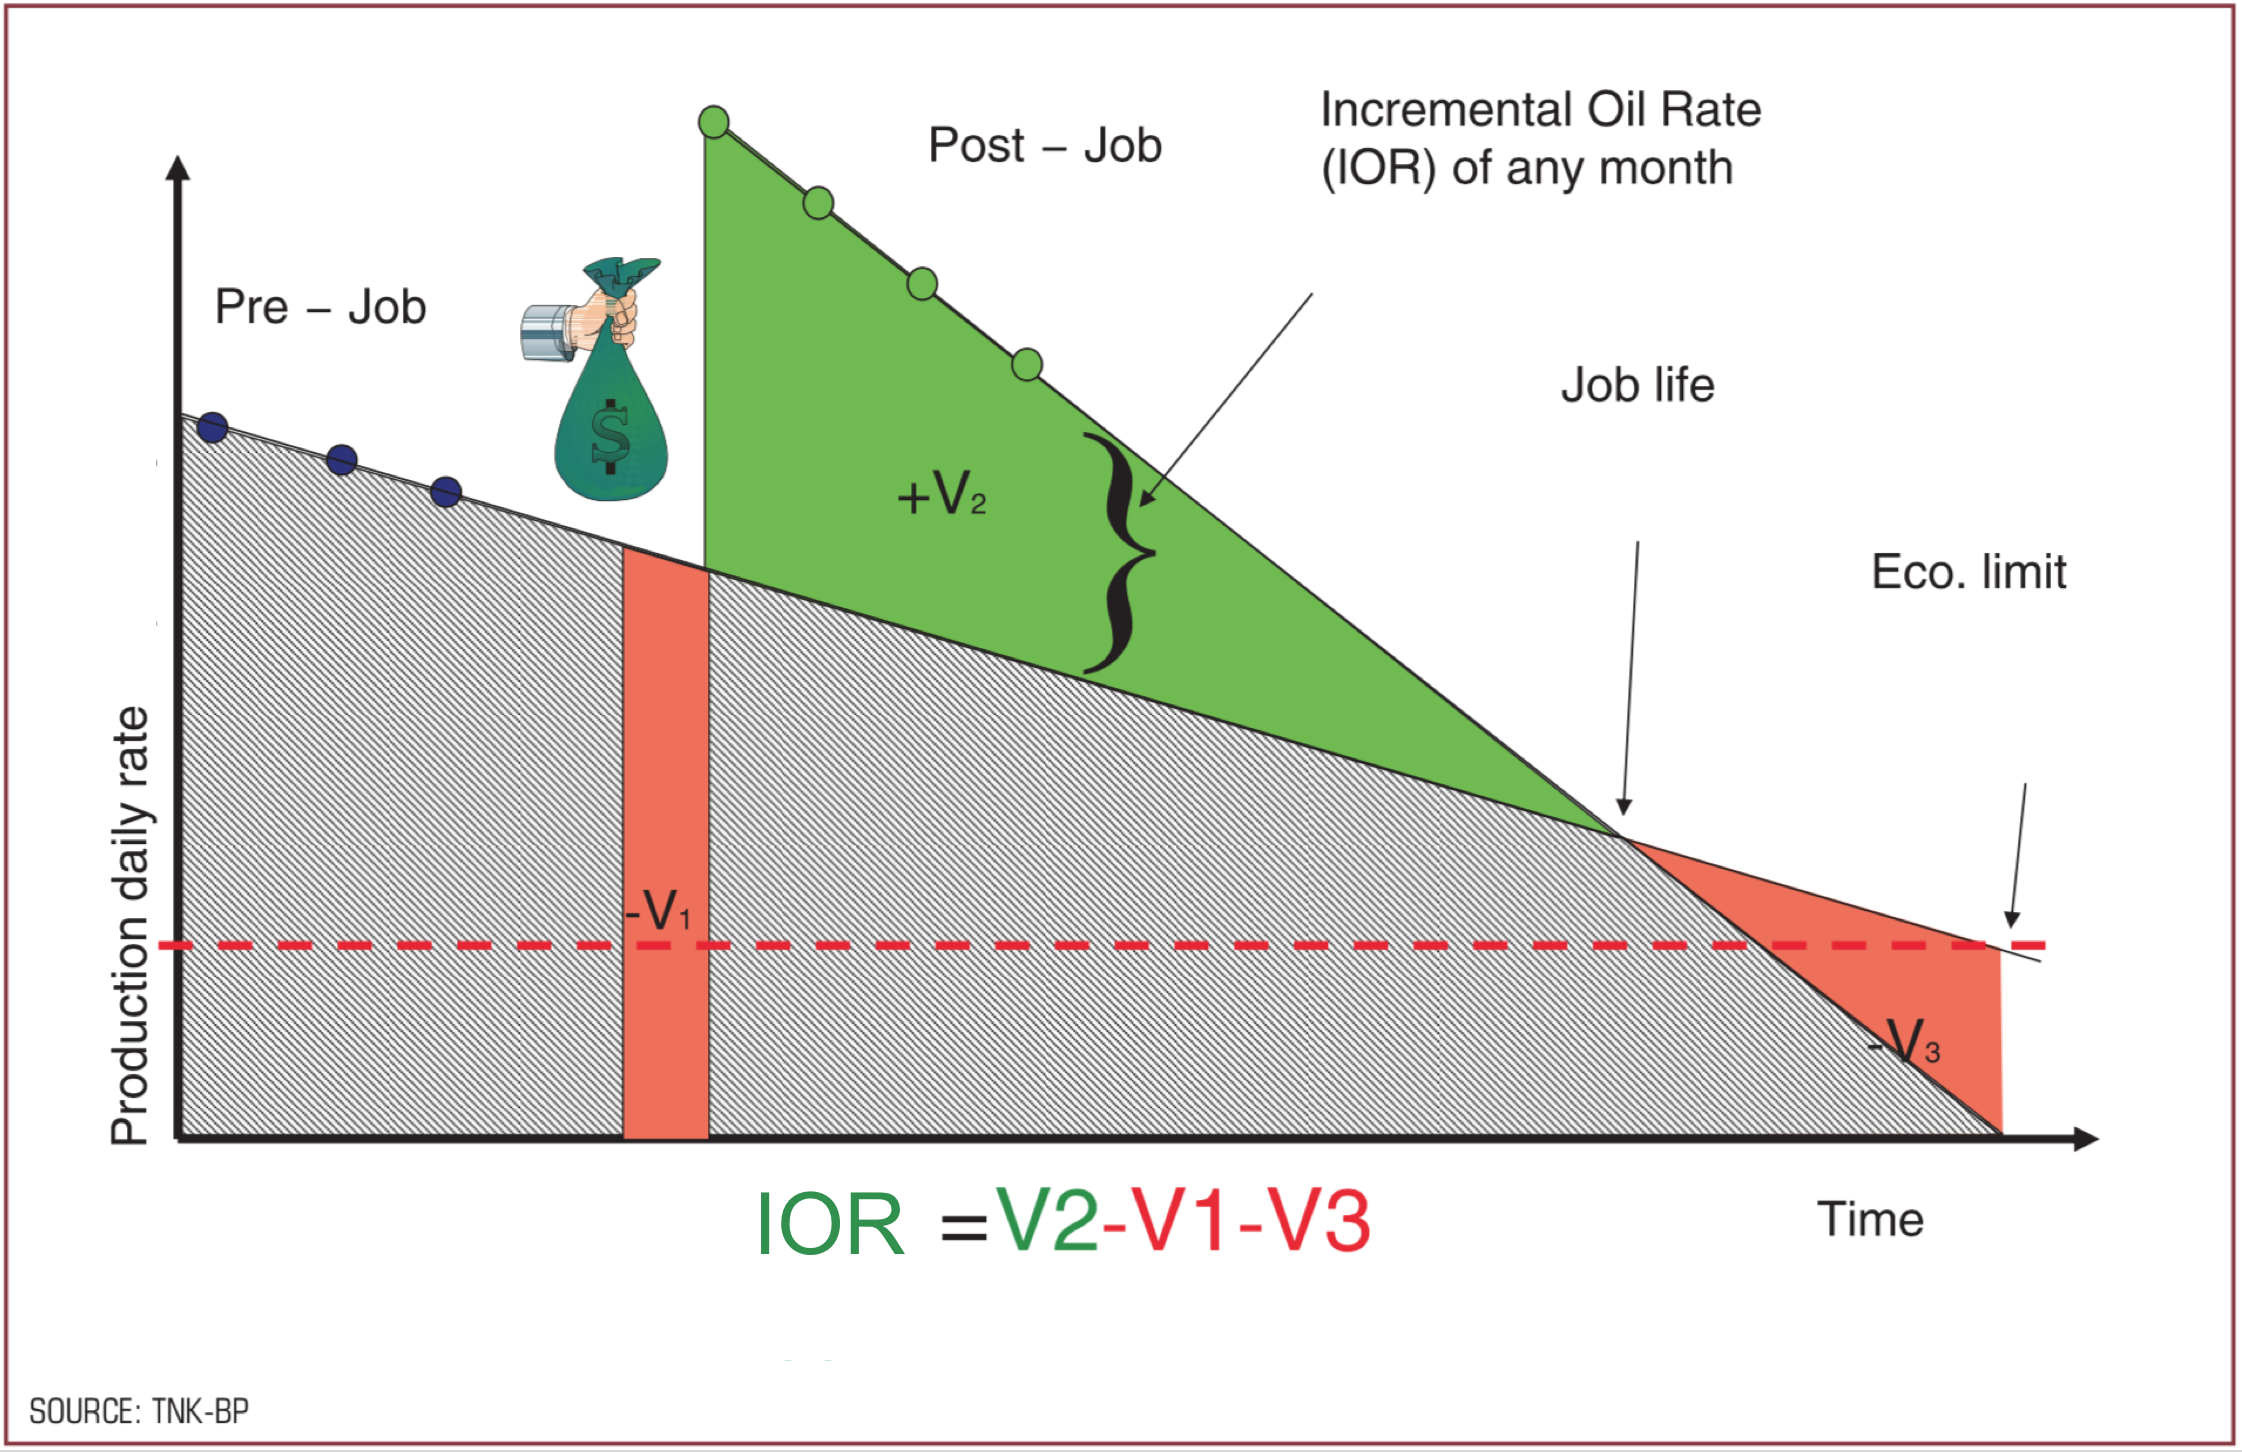
| 12:12, 28 July 2018 | Enhancement Tracking.png (file) |  |
1.46 MB | Enhancement Tracking Innovator 12, TNK-BP Technology Magazine EN only | 2 |
| 05:43, 8 November 2018 | RP O501 EROSIVE WEAR IN PIPING SYSTEMS.pdf (file) | 1.17 MB | RECOMMENDED PRACTICE RP O501 EROSIVE WEAR IN PIPING SYSTEMS. REVISION 4.2 - 2007. DET NORSKE VERITAS (pdf) | 1 | |
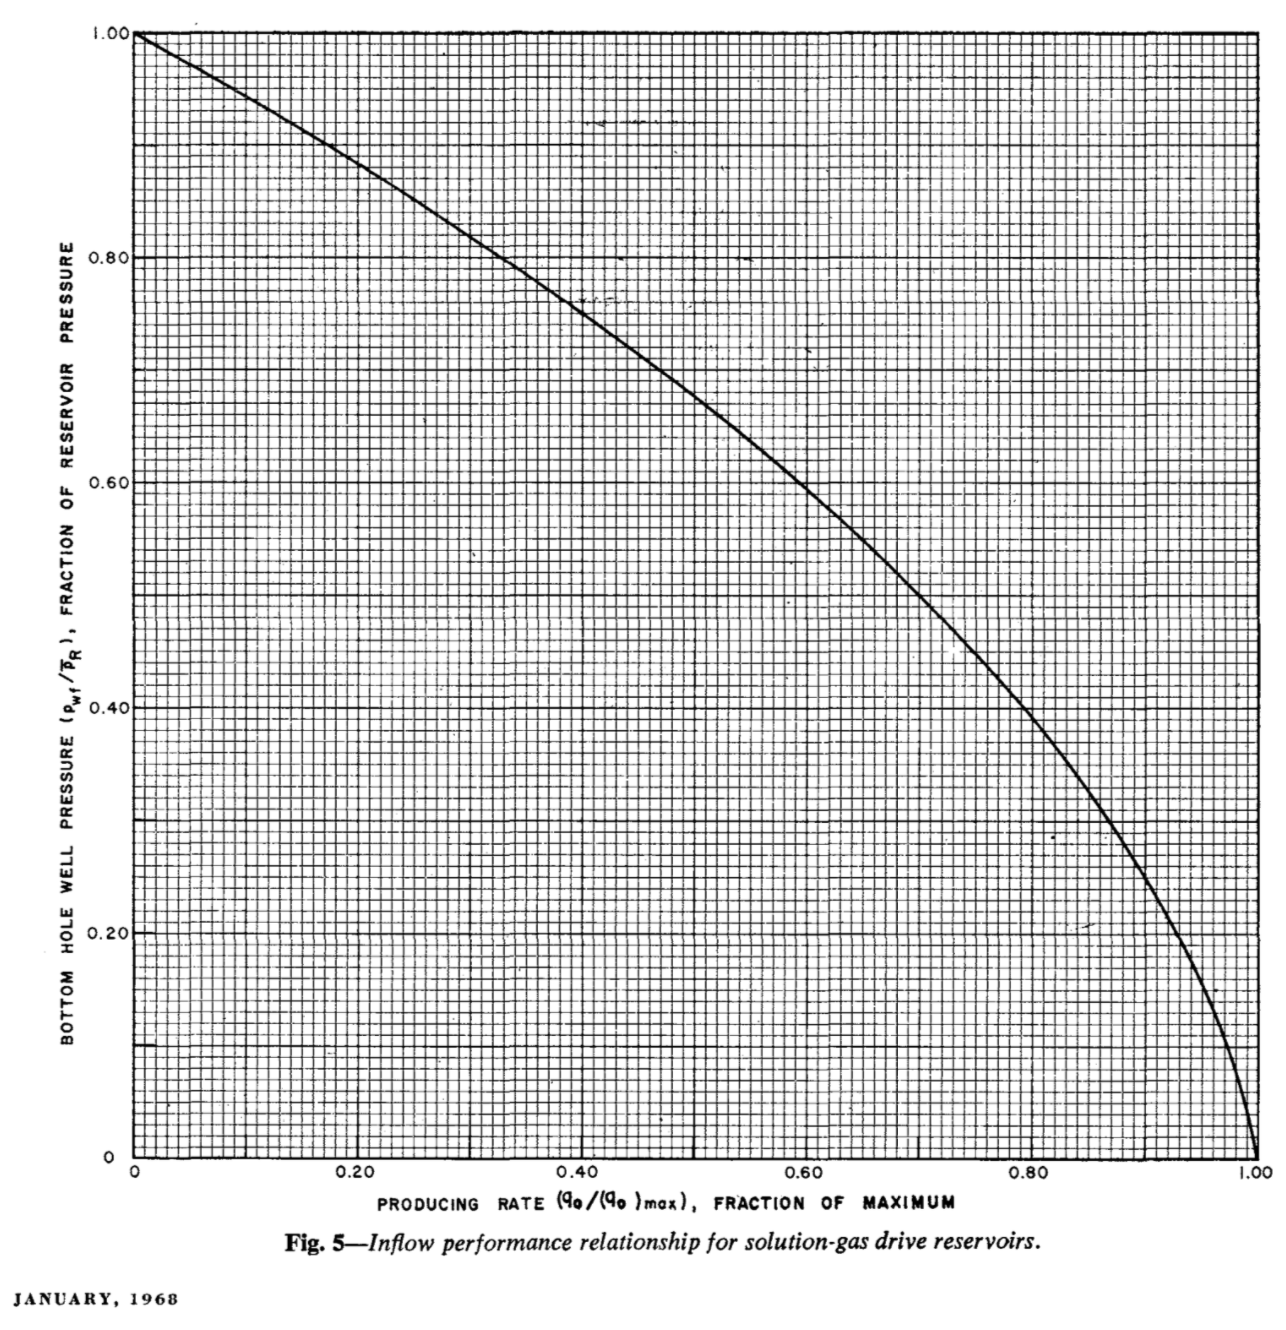
| 08:02, 5 April 2019 | Vogel's.png (file) |  |
1.08 MB | Vogel's inflow performance relationship | 1 |
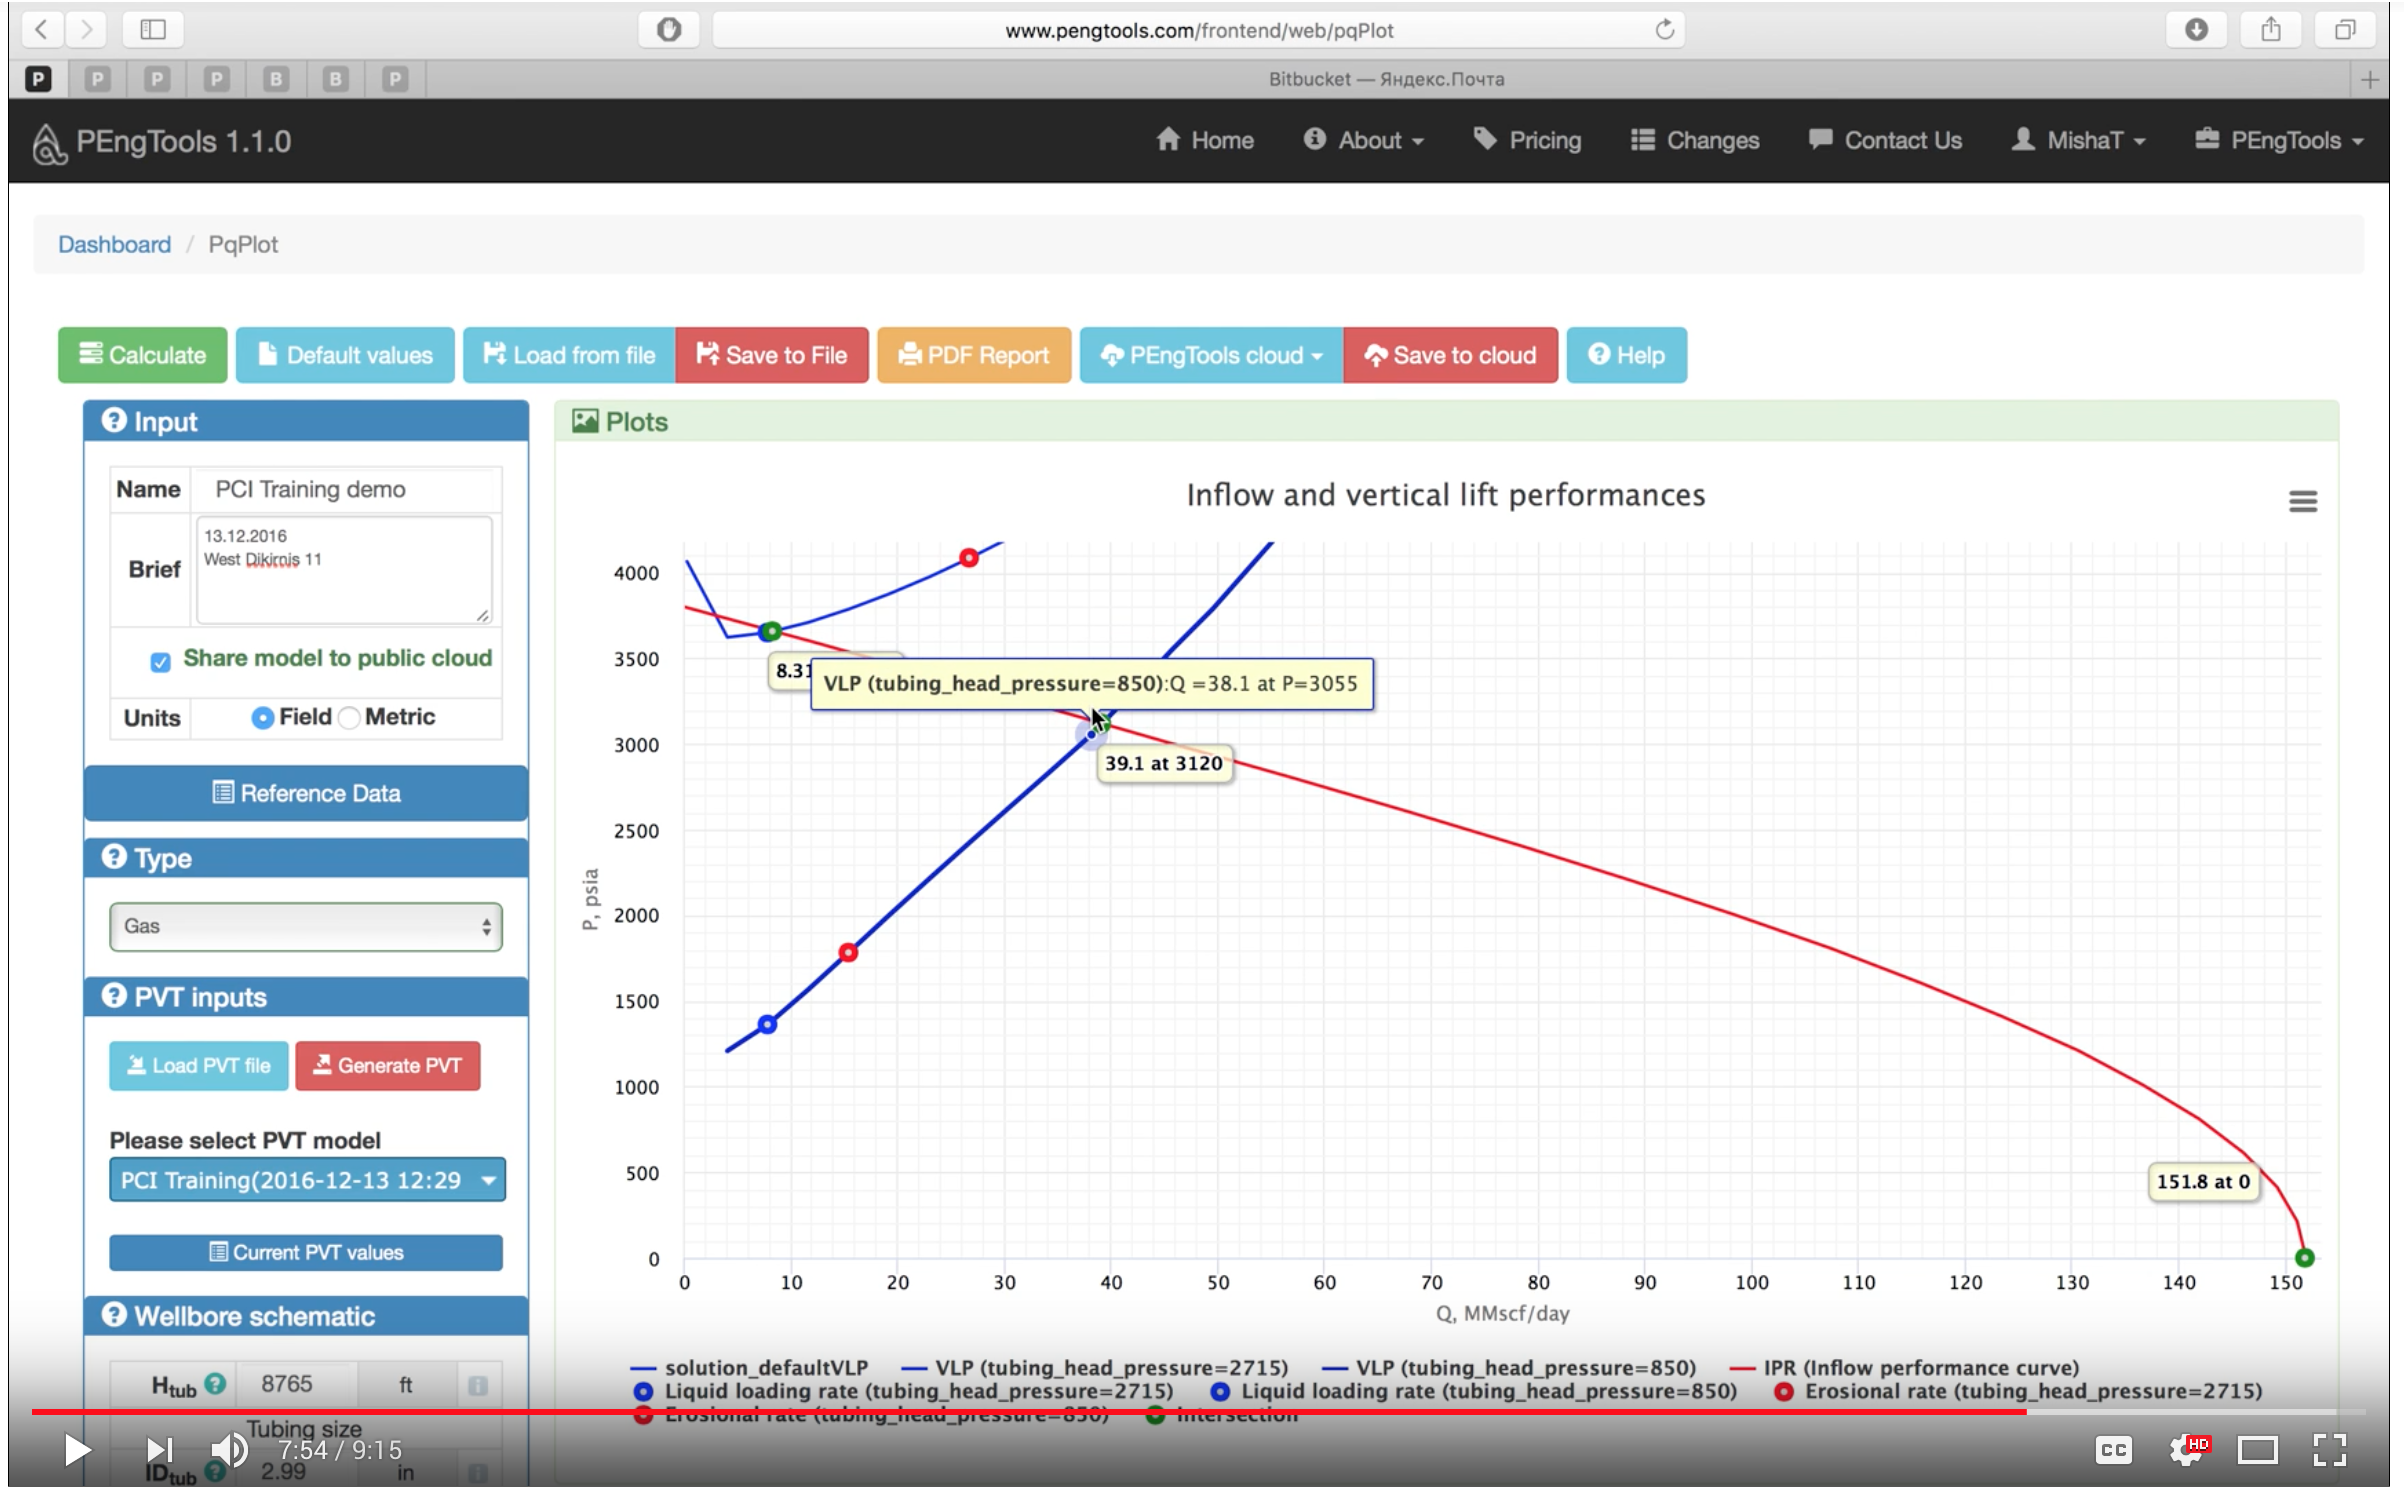
| 15:09, 9 August 2018 | PQplot demo.png (file) |  |
1.05 MB | This video demonstrates basic functionality of the PVT and PQplot tools | 1 |
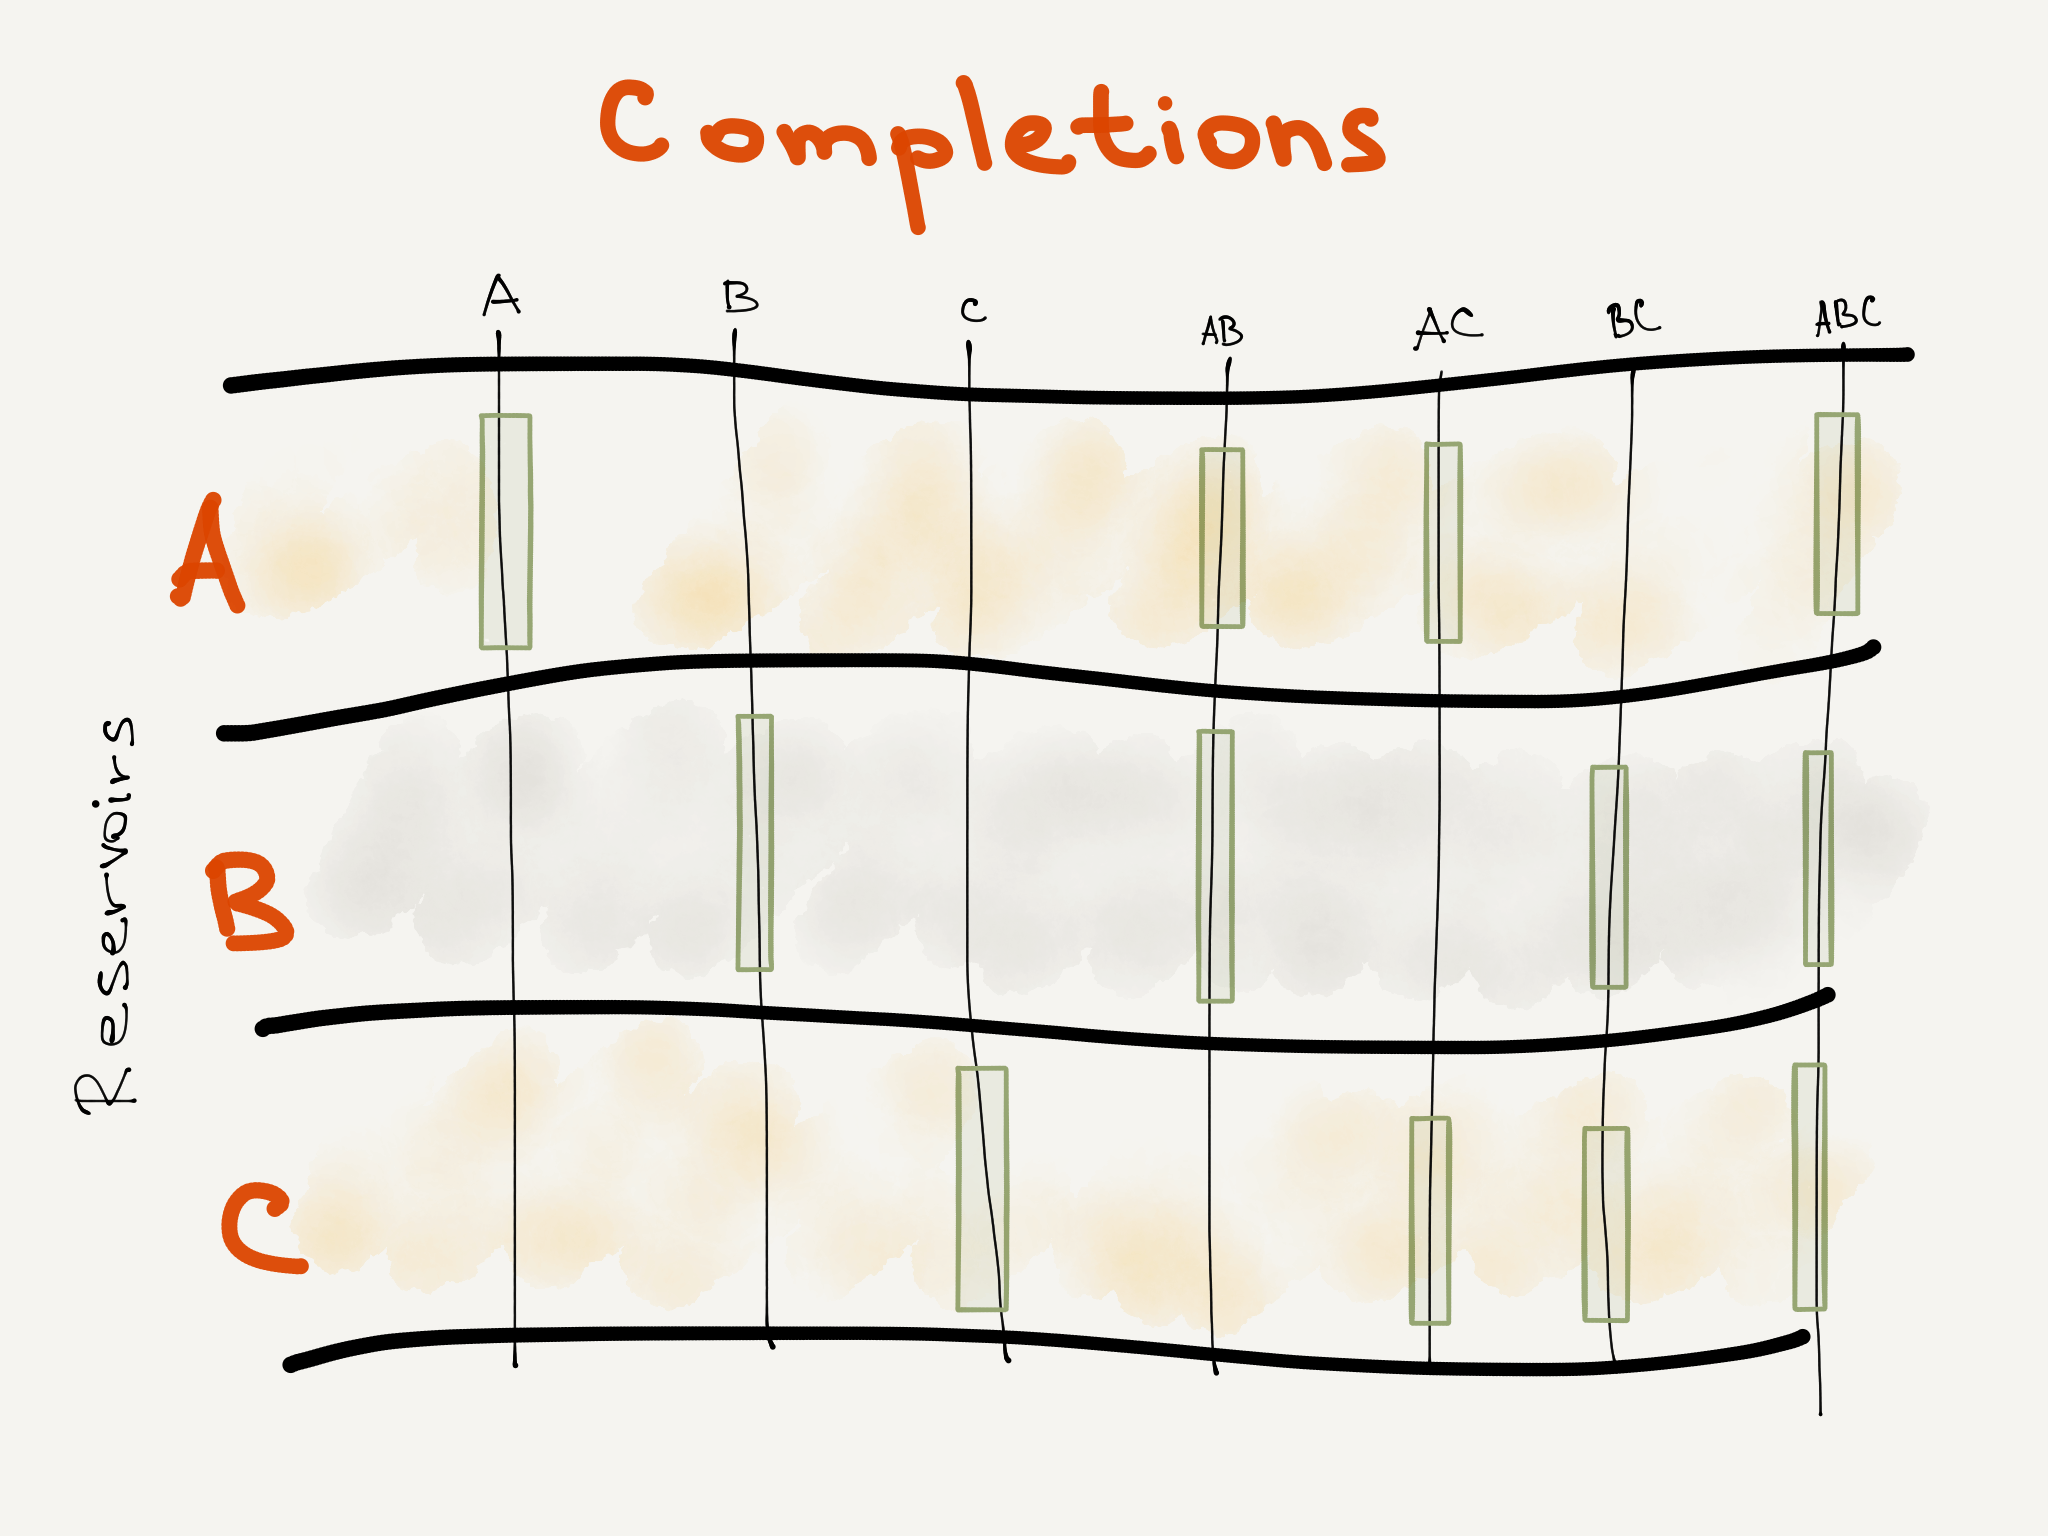
| 16:15, 6 March 2017 | Completion.png (file) |  |
940 KB | Completion examples | 2 |
| 14:22, 31 July 2018 | Enhancement Tracking attacments.zip (file) | 813 KB | Attachments: 1. “Huron 9 Pump Design Report.pdf”. 2. “Huron 9 Frac Design Report.pdf”. 3. “Huron 9 ESP upgrade Report.pdf”. 4. “Huron wells.csv”. 5. “Huron wells daily measures.csv”. 6. “Huron wells production forecast data.csv... | 1 | |
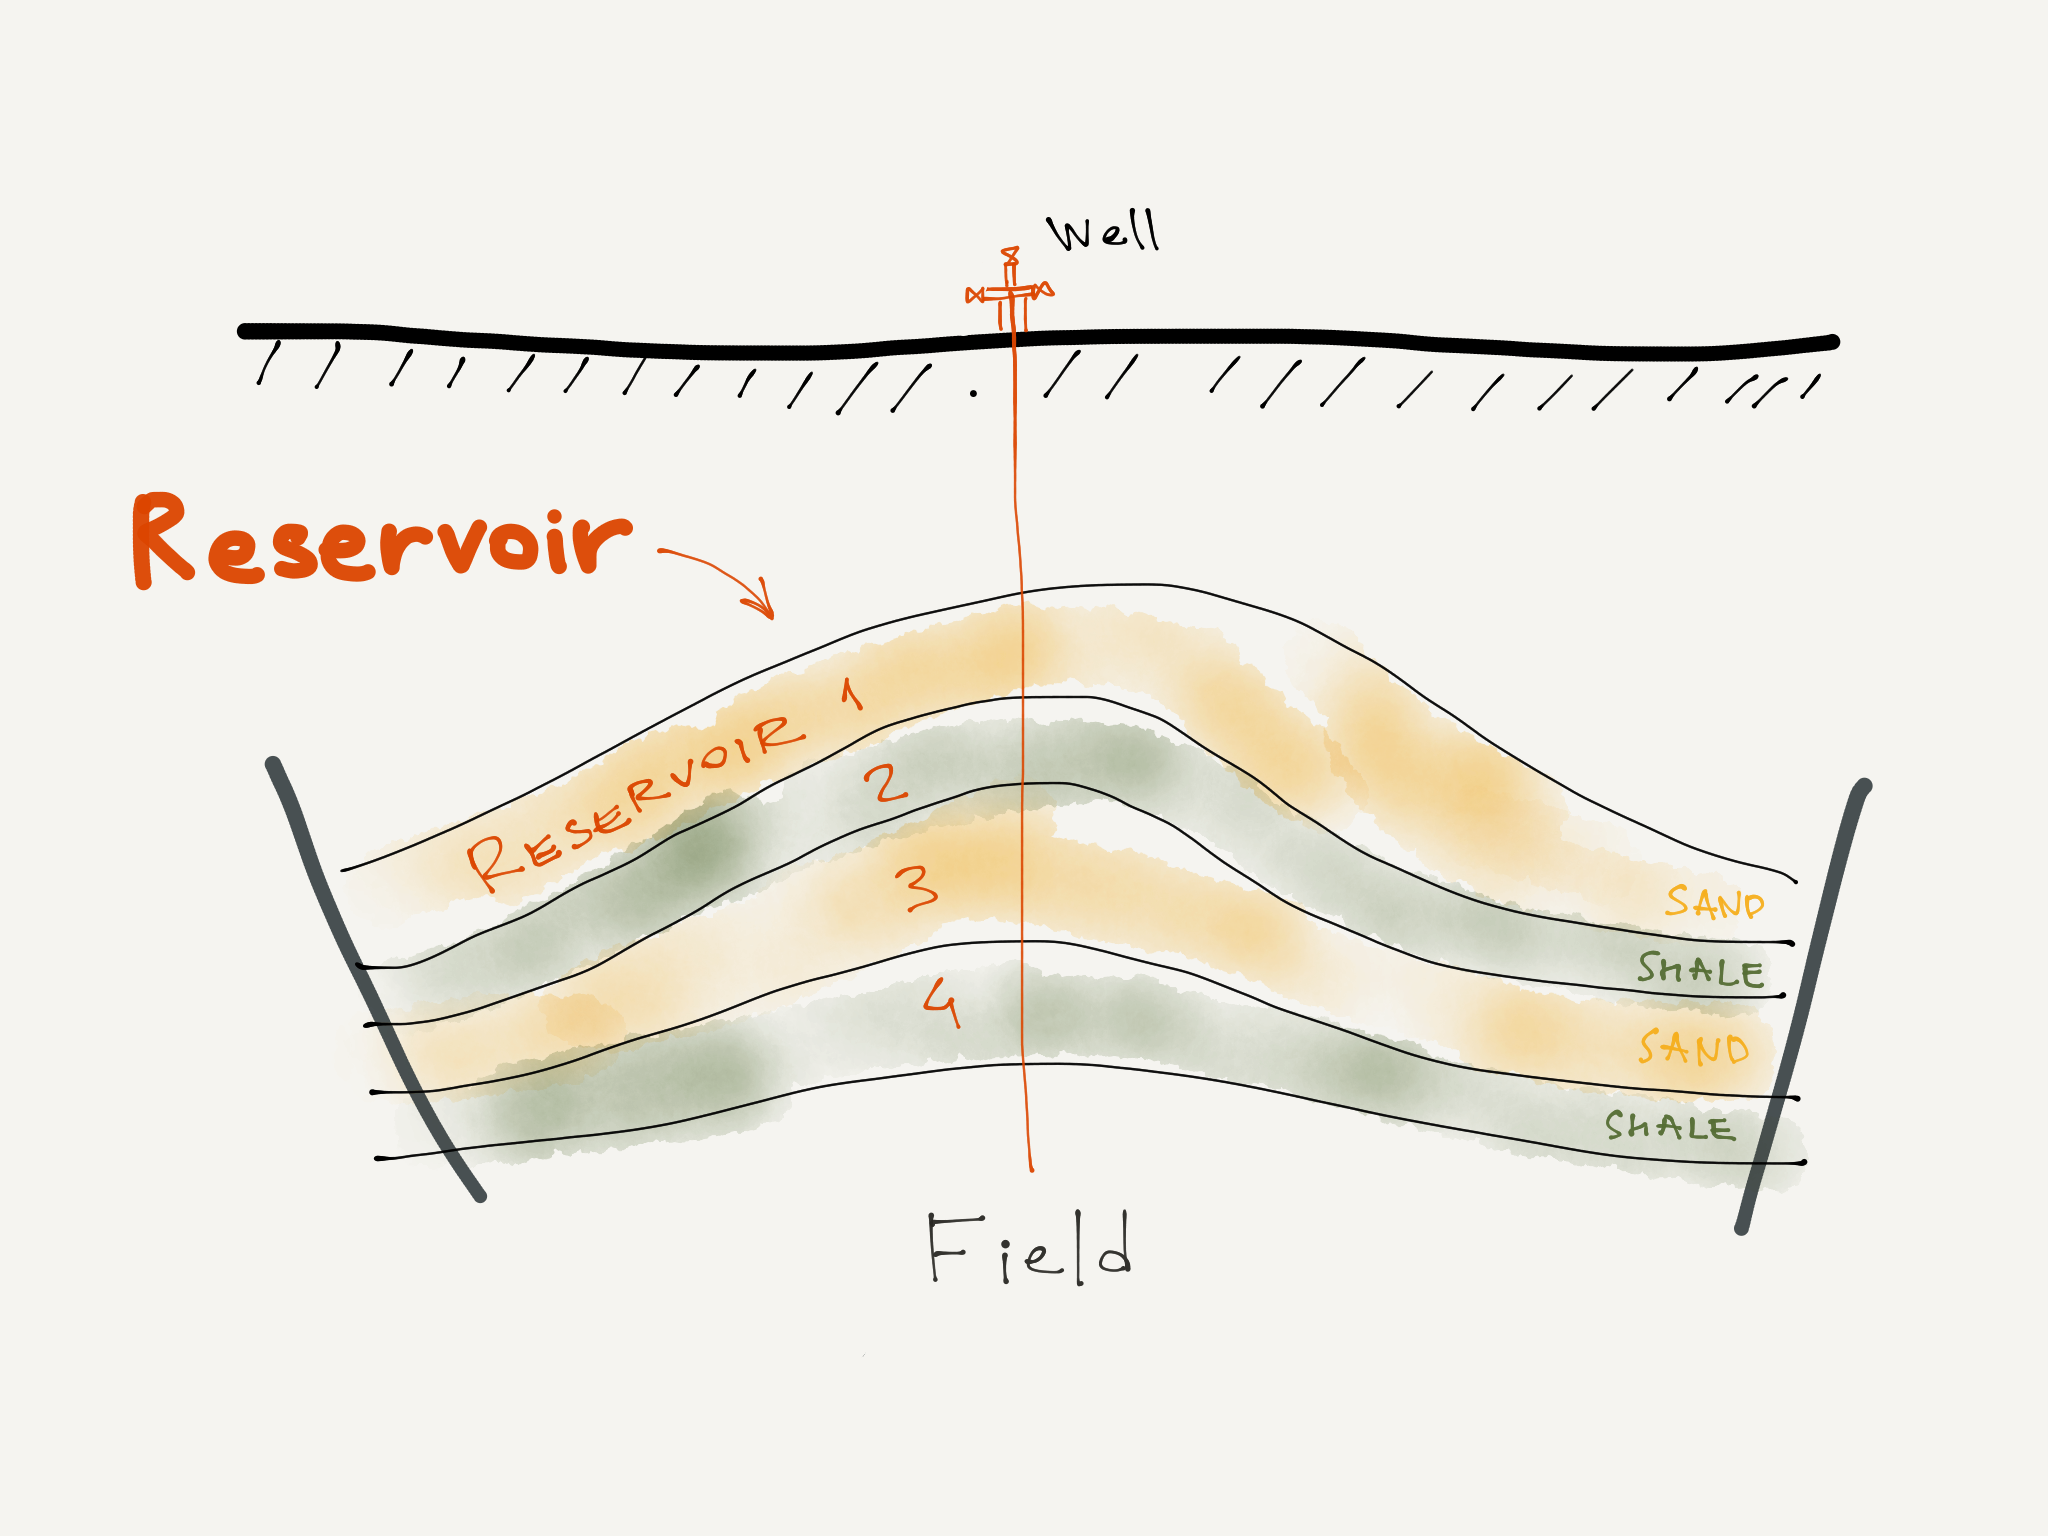
| 15:28, 6 March 2017 | Reservoir.png (file) |  |
785 KB | Reservoirs example | 1 |
| 17:28, 8 August 2018 | PVT demo.png (file) |  |
709 KB | pengtools.com PVT demo at youtube.com | 1 |
| 11:28, 27 January 2017 | MWFA.png (file) |  |
672 KB | Mature Water Flood Analysis | 1 |
| 13:30, 31 July 2018 | Enhancment Tracking Case Study.png (file) |  |
508 KB | Enhancement Tracking Case Study title page | 2 |
| 16:27, 28 July 2017 | Petroleum Engineering Timeline.png (file) |  |
496 KB | Petroleum Engineering Timeline v5 | 3 |
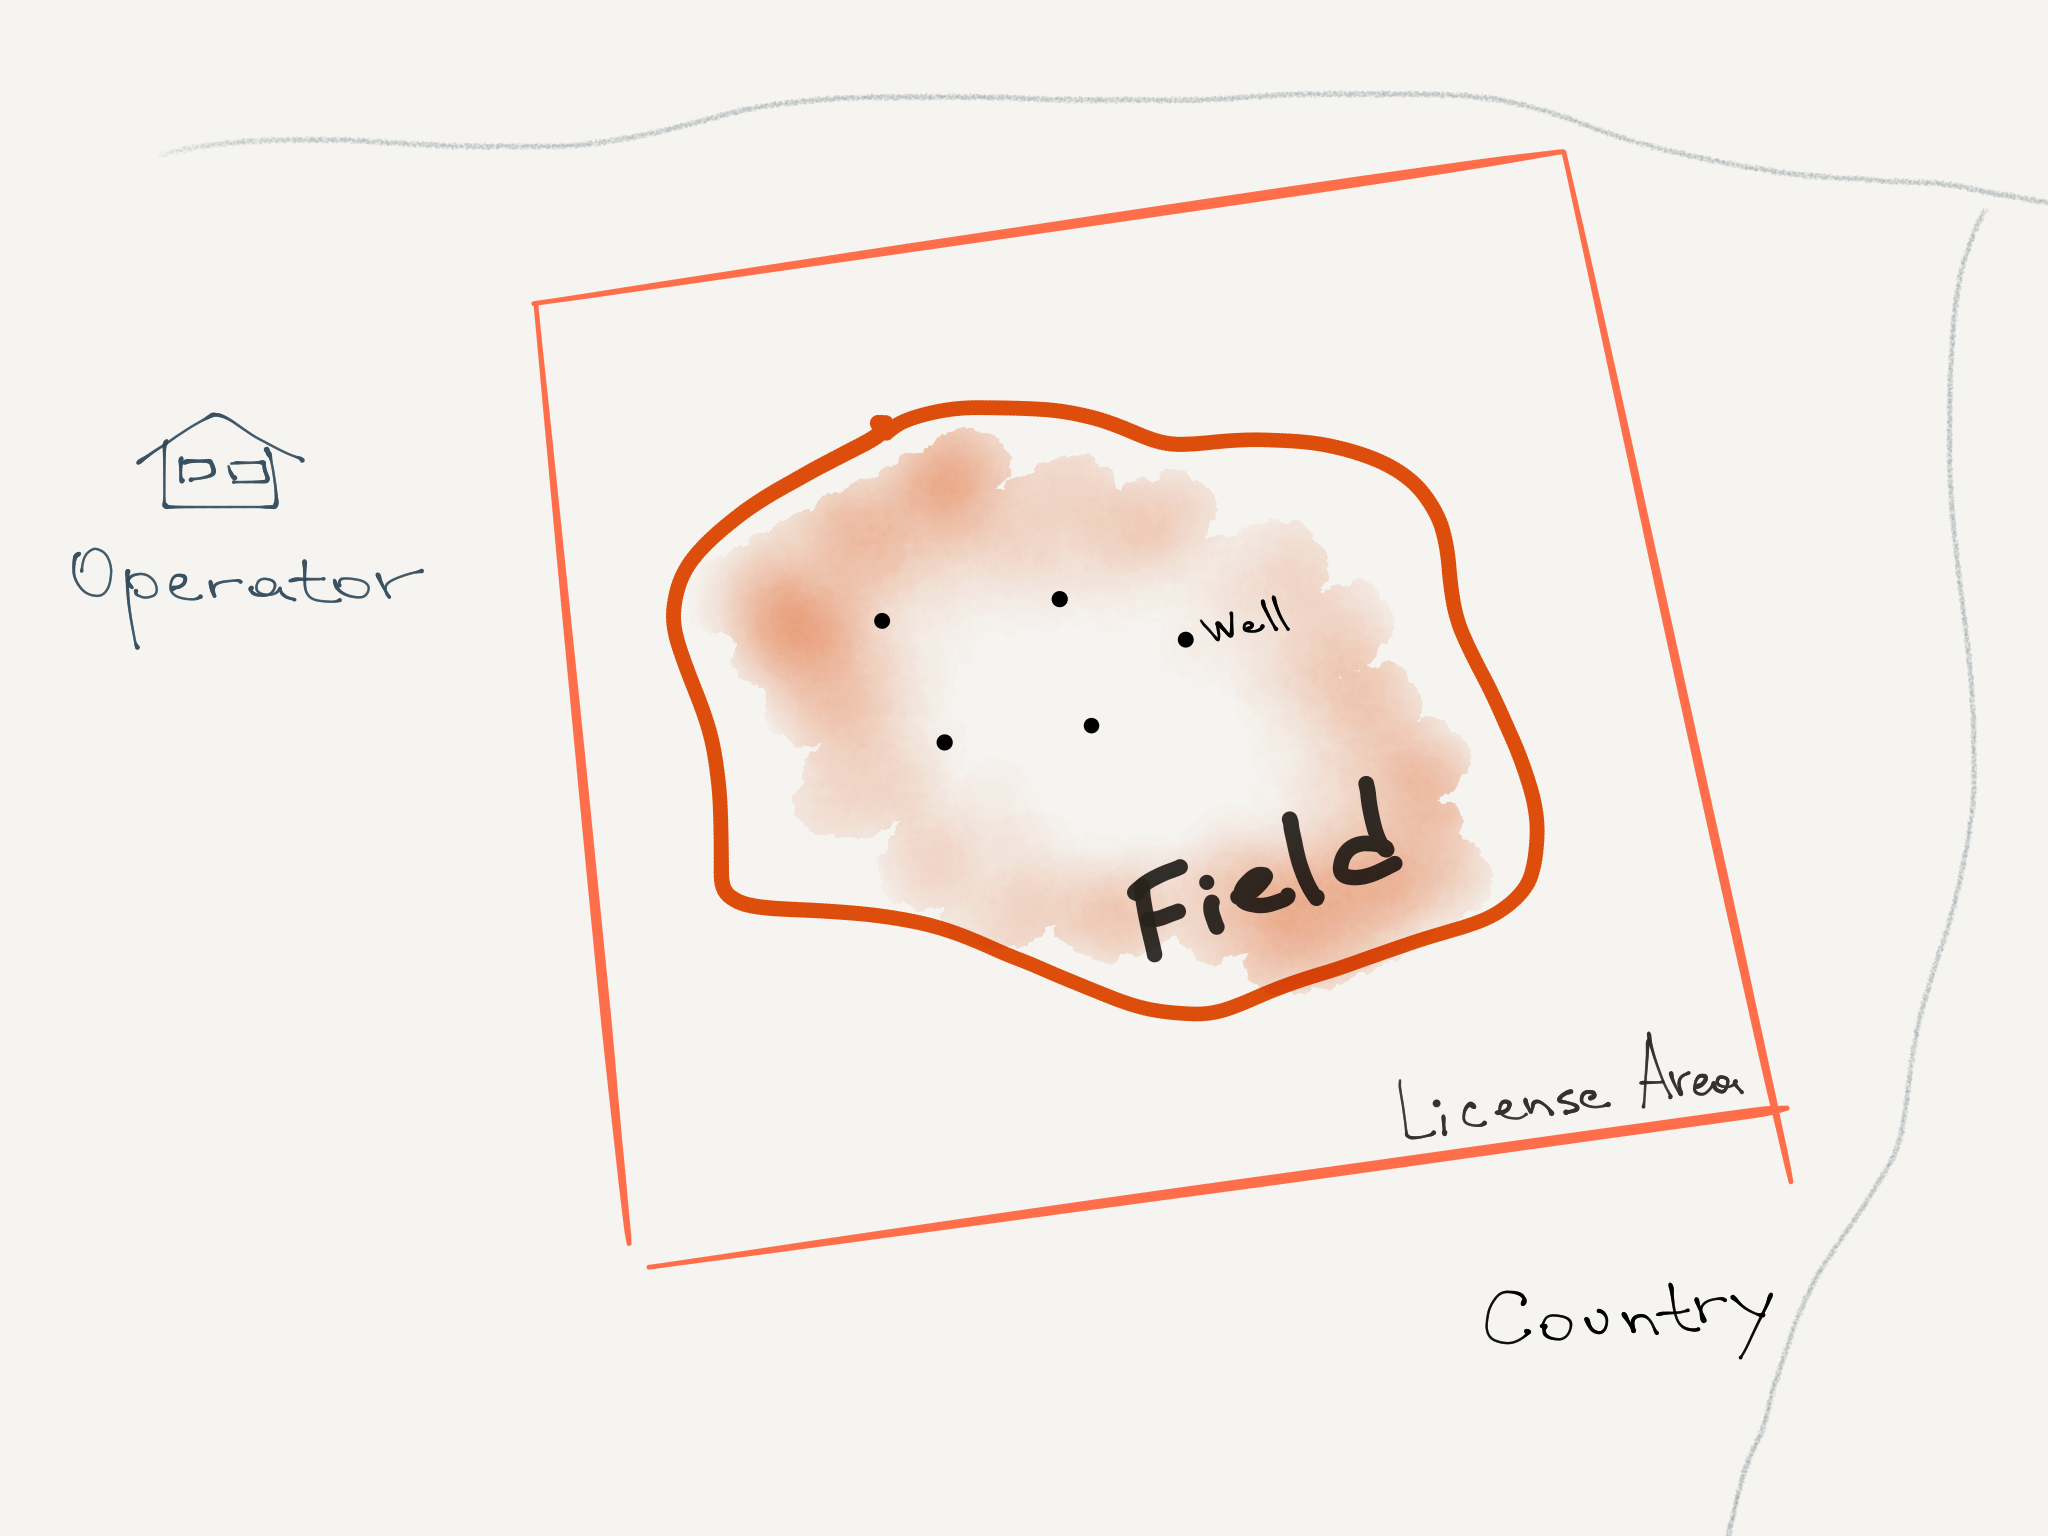
| 15:01, 6 March 2017 | Field.png (file) |  |
491 KB | Field example | 1 |
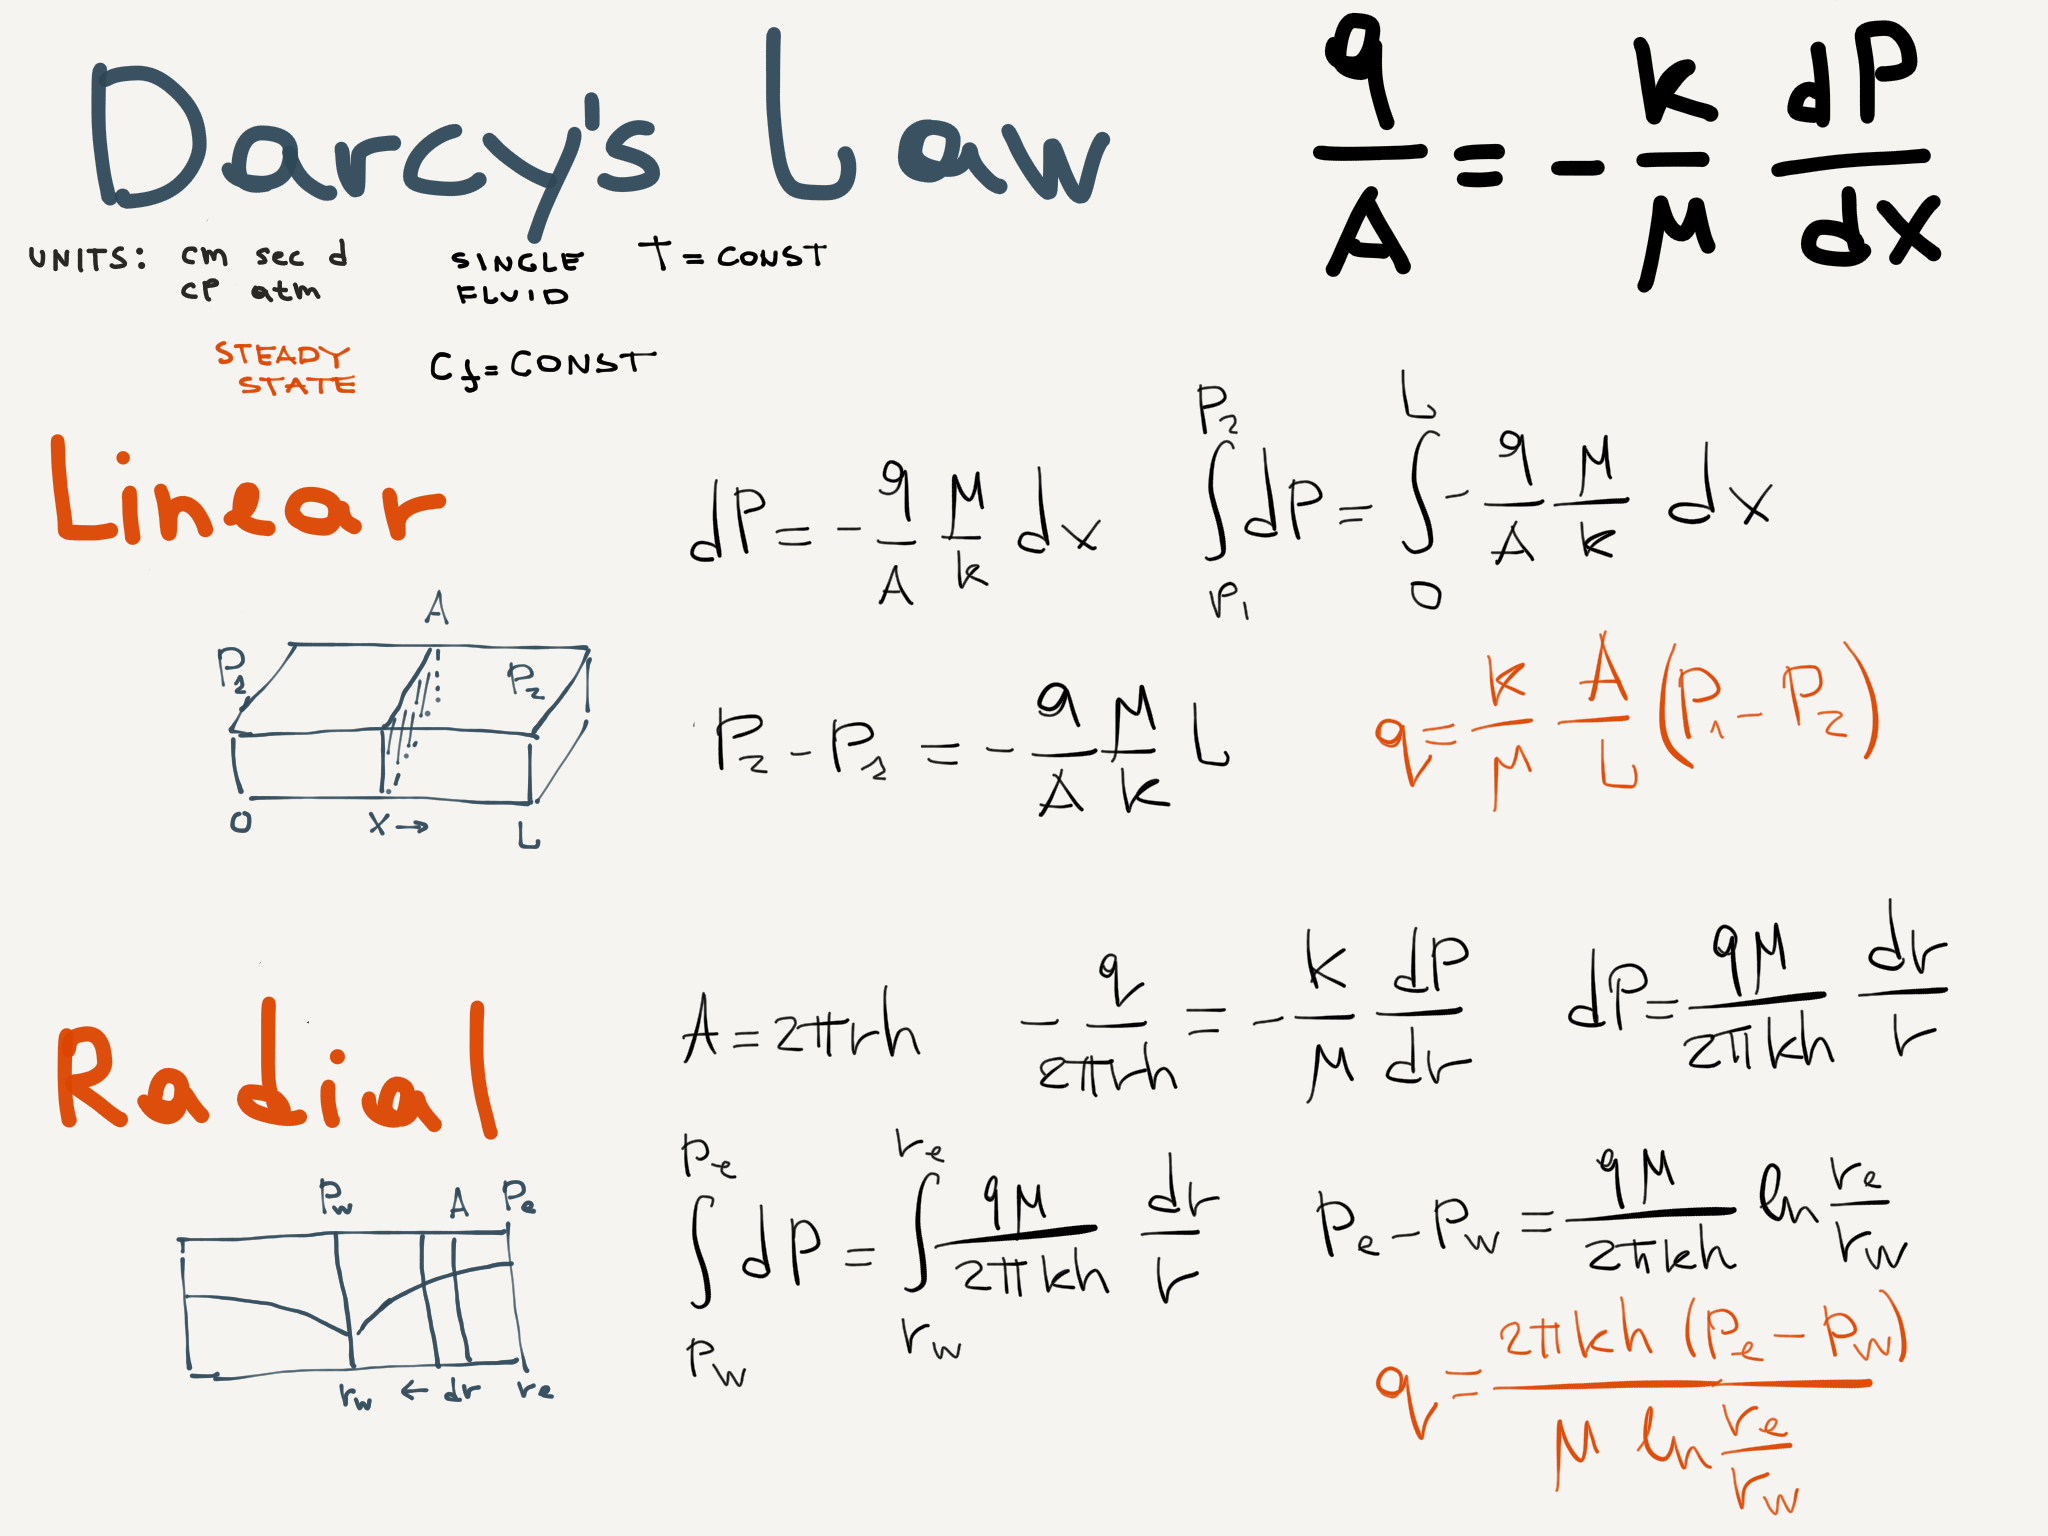
| 12:57, 23 April 2018 | Darcy's Law mtuz.png (file) |  |
420 KB | Darcy's Law Linear and Radial inflow equations | 1 |
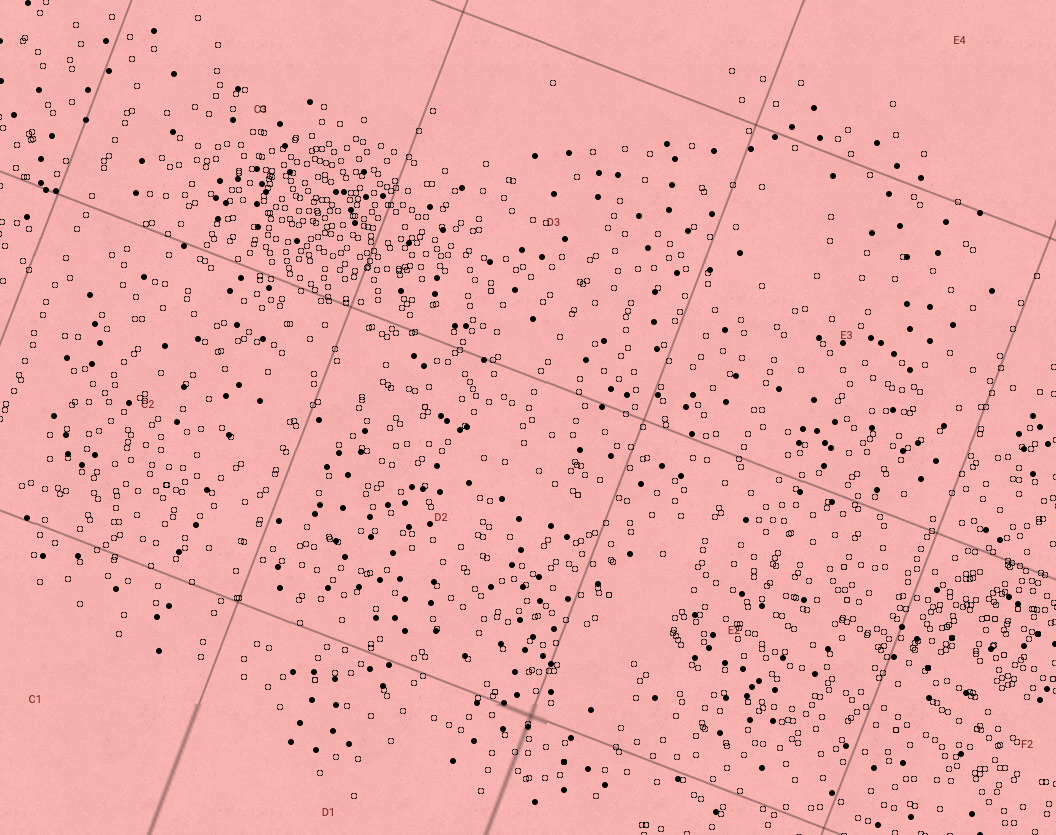
| 15:43, 23 March 2022 | Block in waterflooding.png (file) |  |
367 KB | Example of dividing the field into the blocks in mature waterflood analysis | 1 |
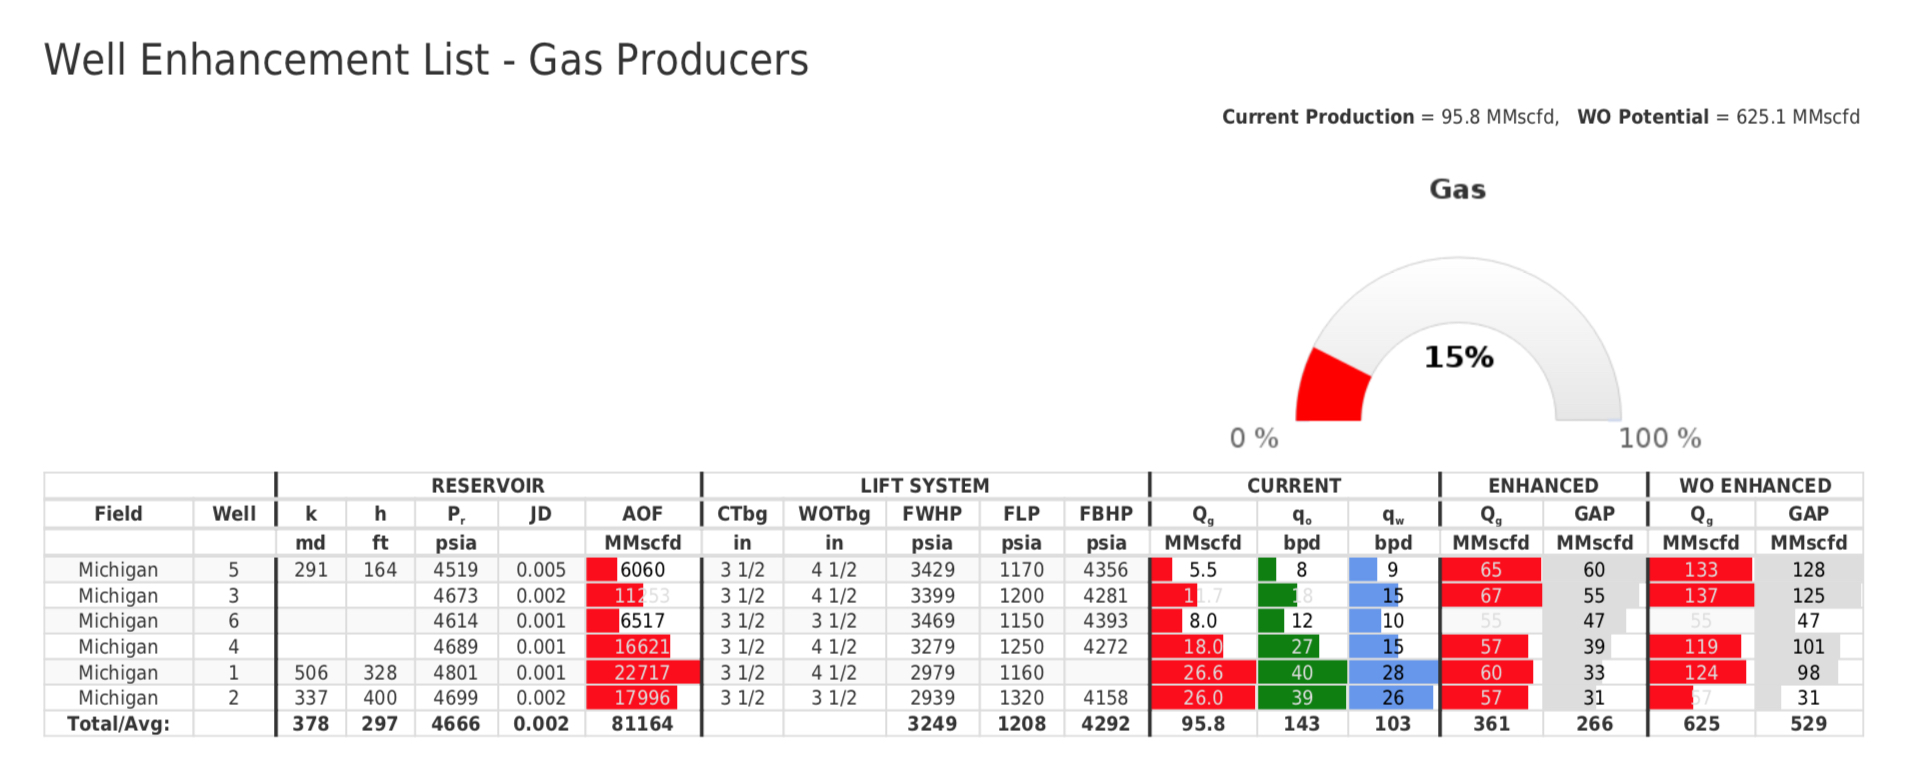
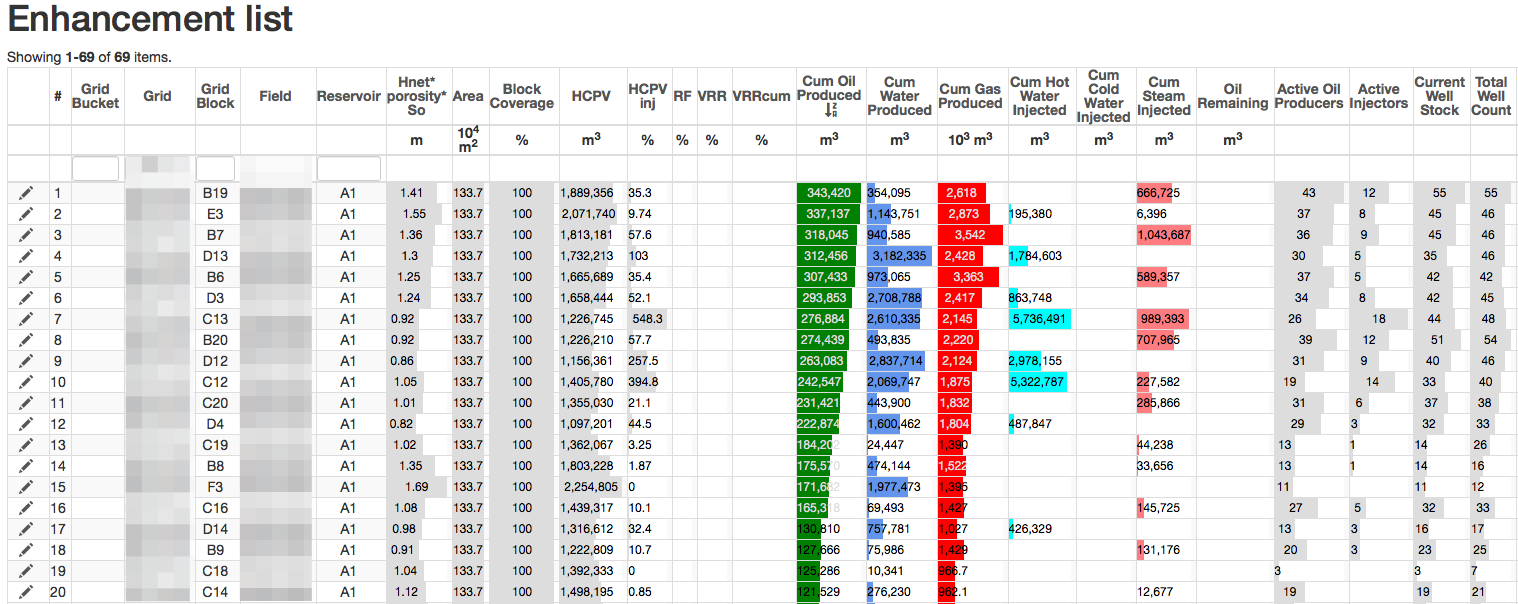
| 13:13, 31 July 2018 | Enhancement List.jpeg (file) |  |
364 KB | Well Enhancement List at E&P Portal | 1 |
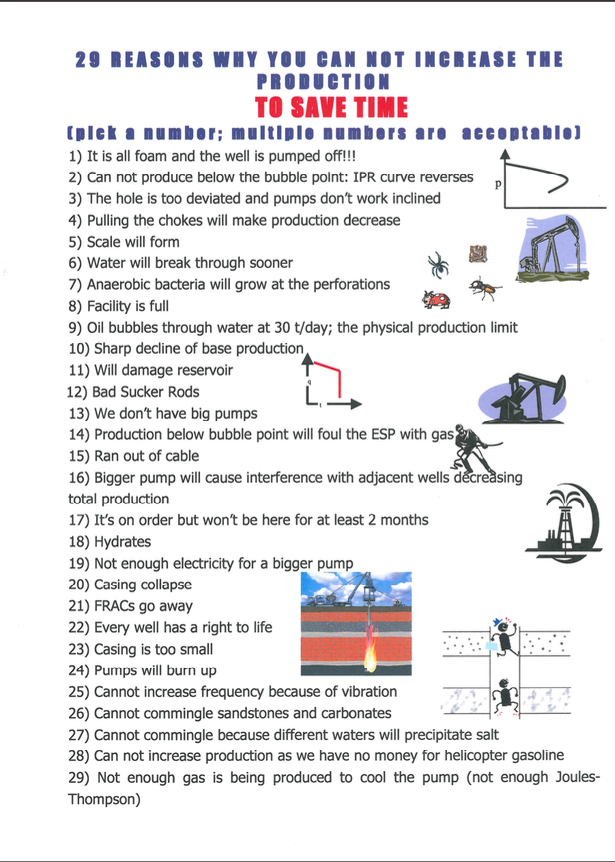
| 11:52, 14 December 2018 | Reasons.png (file) |  |
356 KB | 29+ reasons why you can not increase the production | 2 |
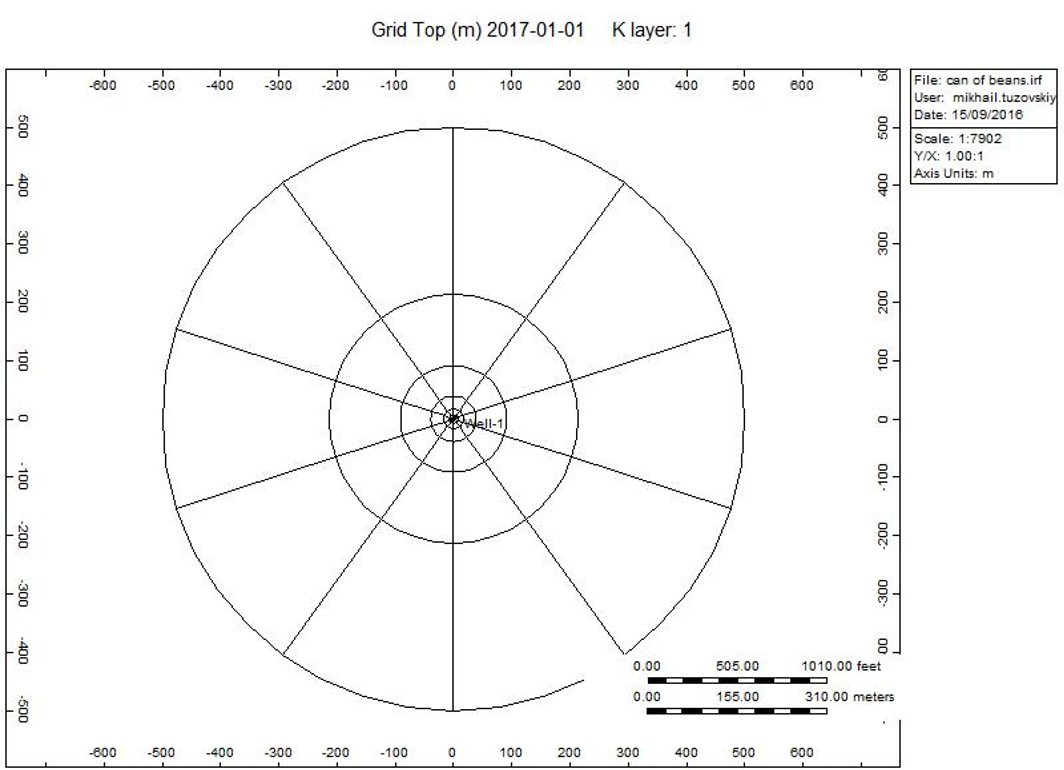
| 09:00, 12 December 2022 | Can of Beans (Gas) model.png (file) | _model.png) |
333 KB | Can_of_Beans_(Gas)_model | 1 |
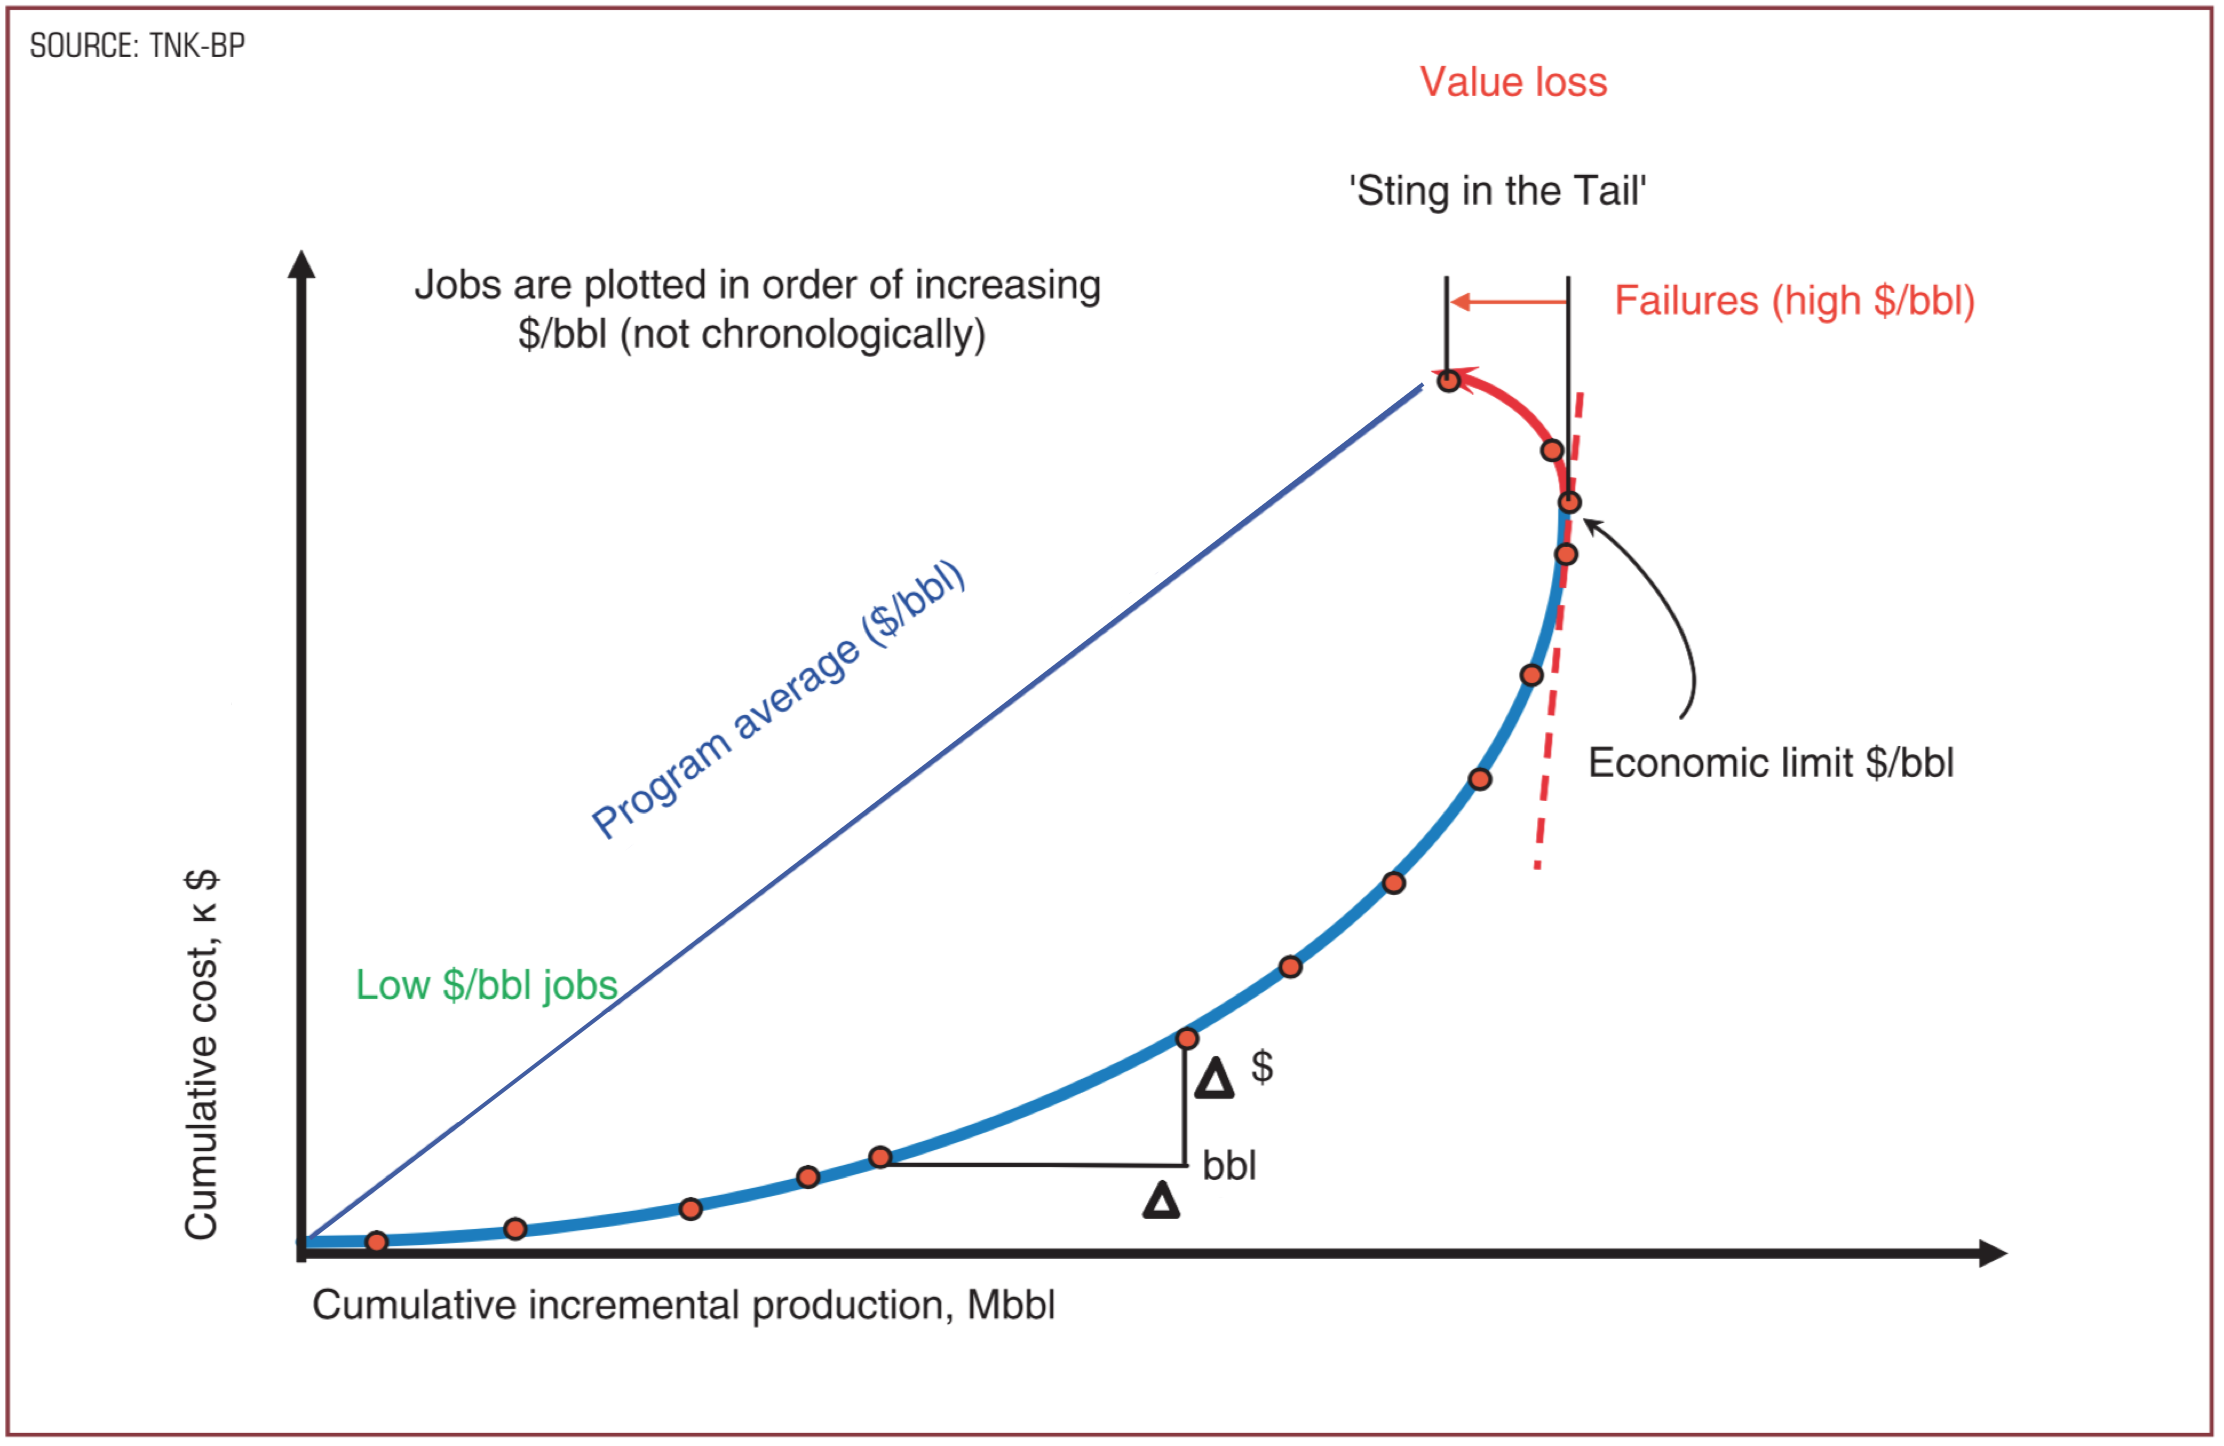
| 12:21, 28 July 2018 | Scorpion plot.png (file) |  |
290 KB | Scorpion plot Innovator 12, TNK-BP Technology Magazine EN only | 2 |
| 09:12, 16 March 2017 | Liquid Loading.png (file) |  |
289 KB | 1 | |
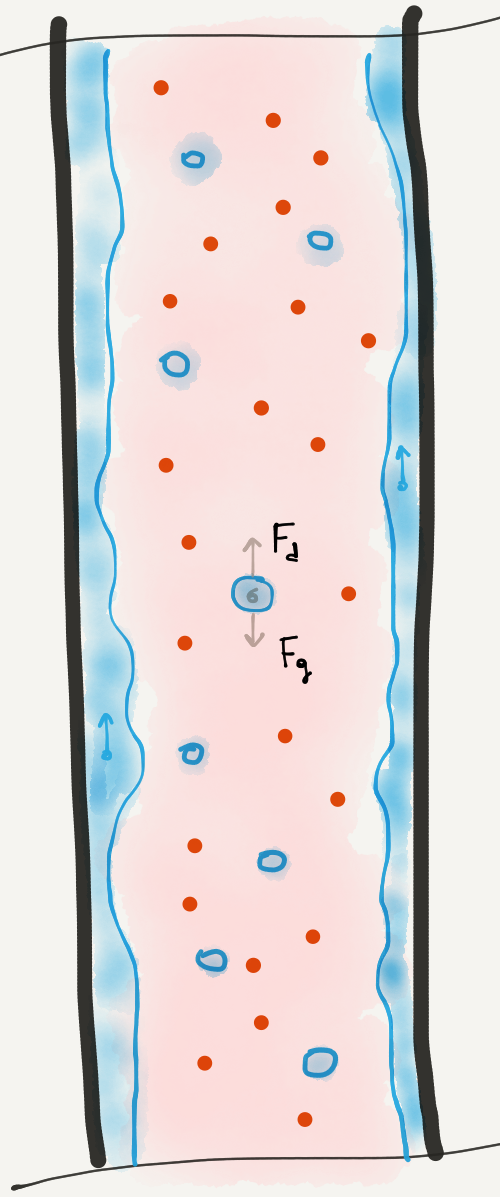
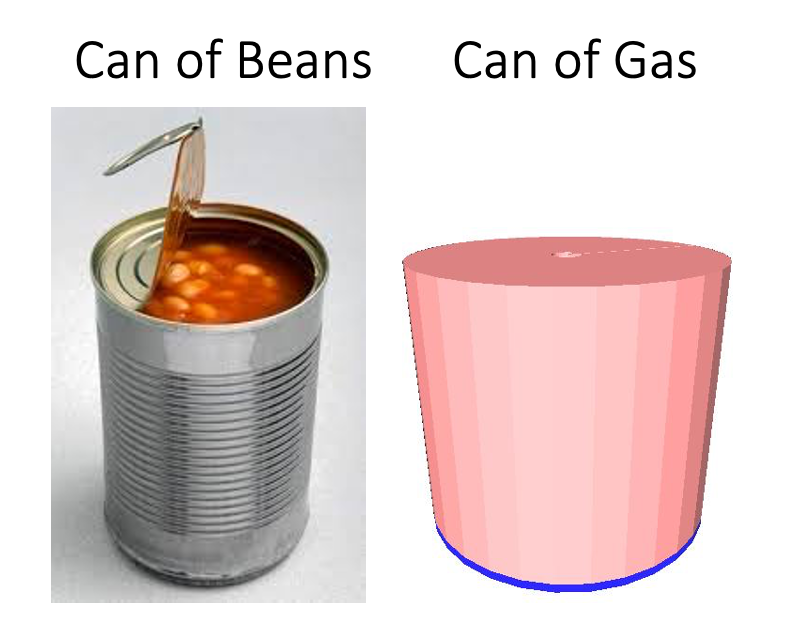
| 07:07, 12 December 2022 | Can Of Beans (Gas).png (file) | .png) |
289 KB | Can Of Beans (Gas) | 1 |
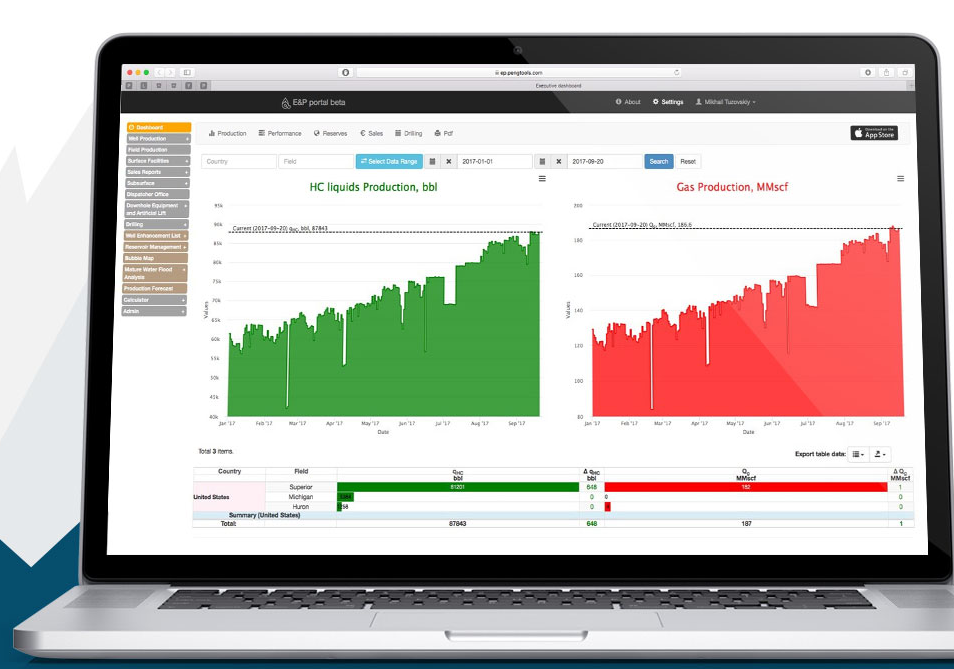
| 08:58, 6 December 2017 | EPPortal.png (file) |  |
284 KB | E&P Portal | 1 |
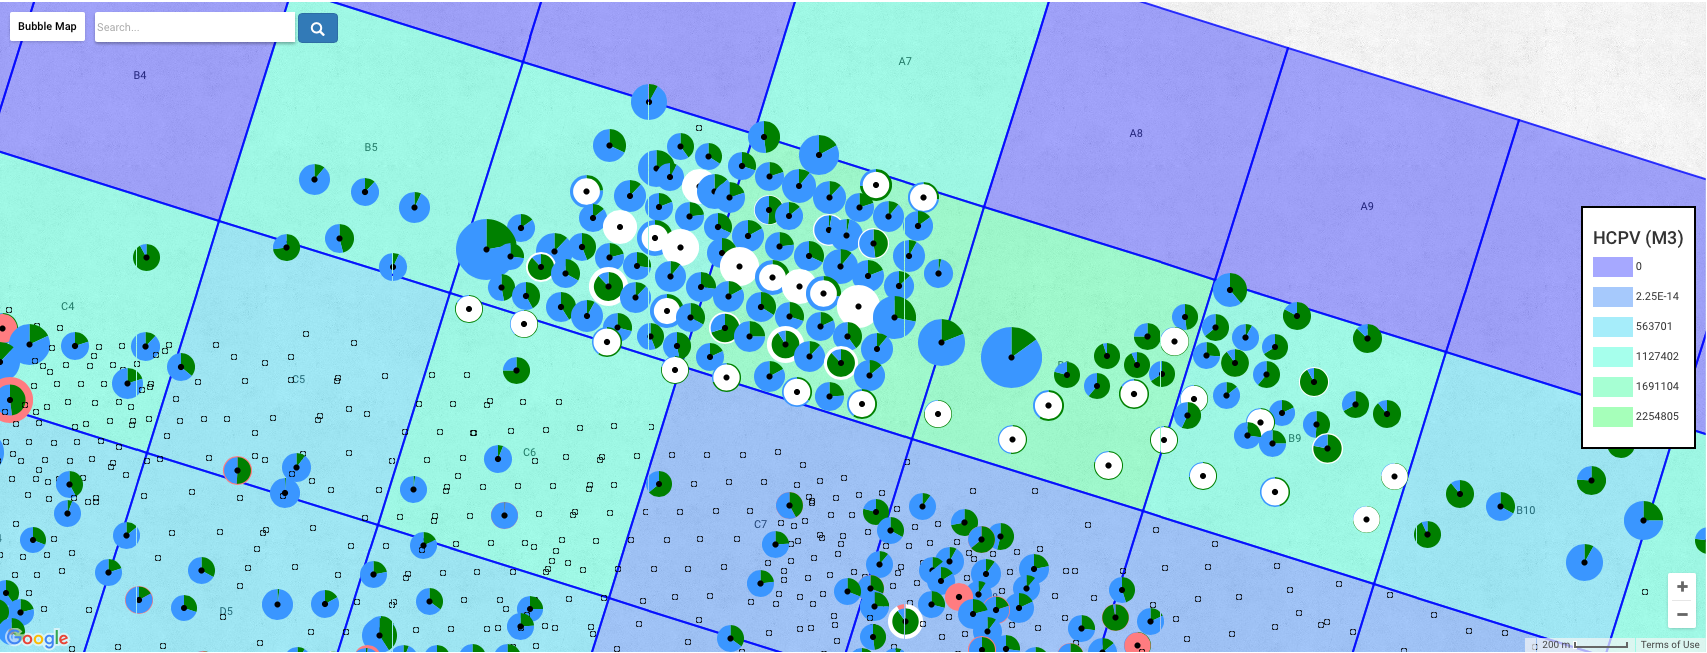
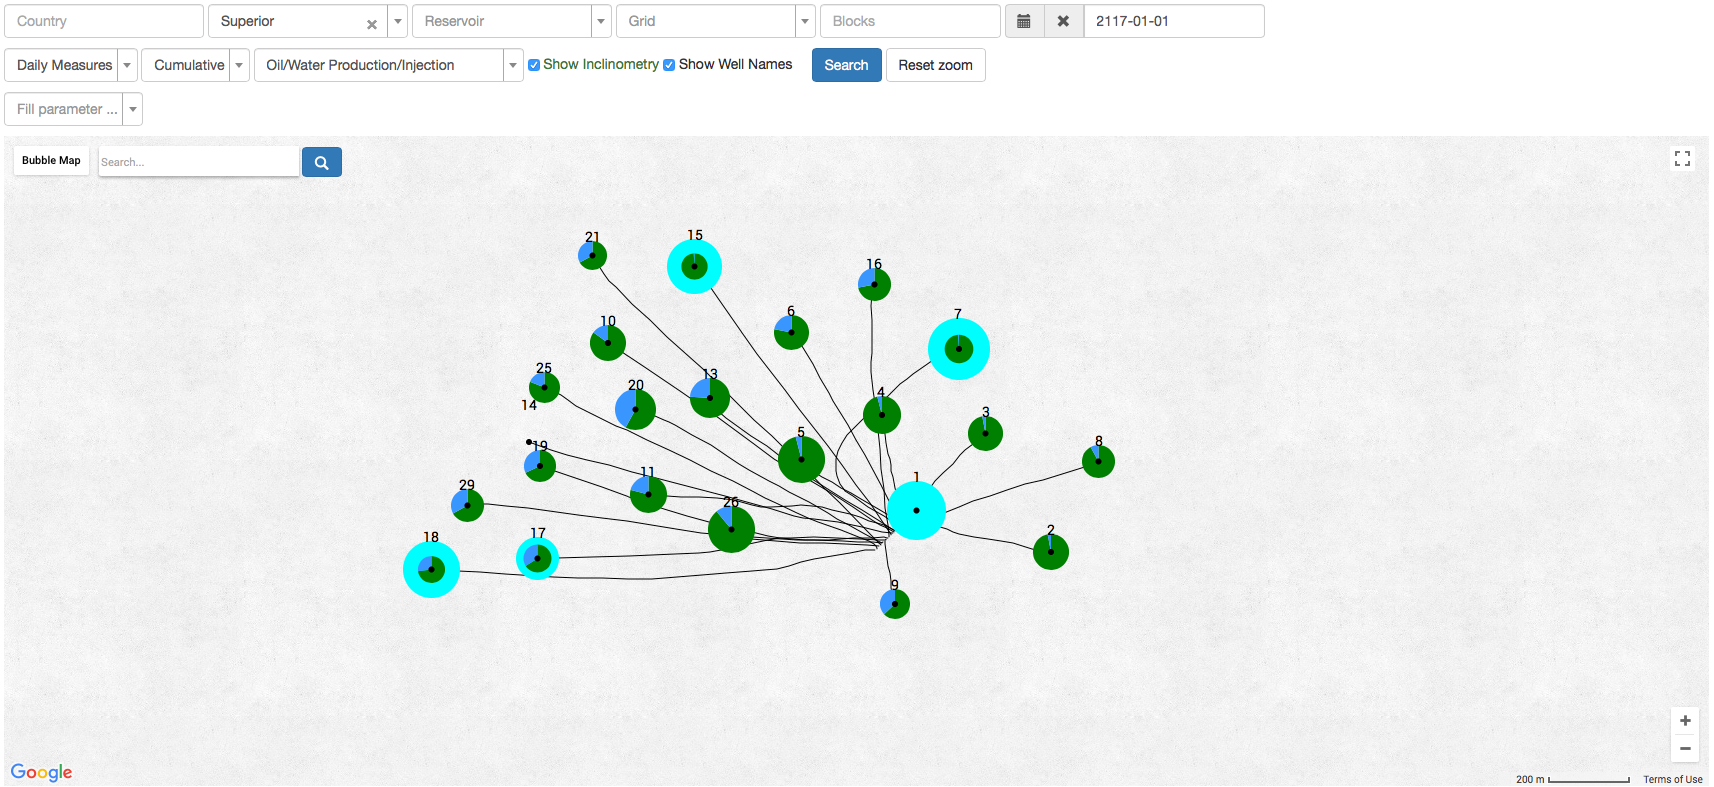
| 12:25, 27 December 2017 | BubbleMap.png (file) |  |
273 KB | Bubble map example | 1 |
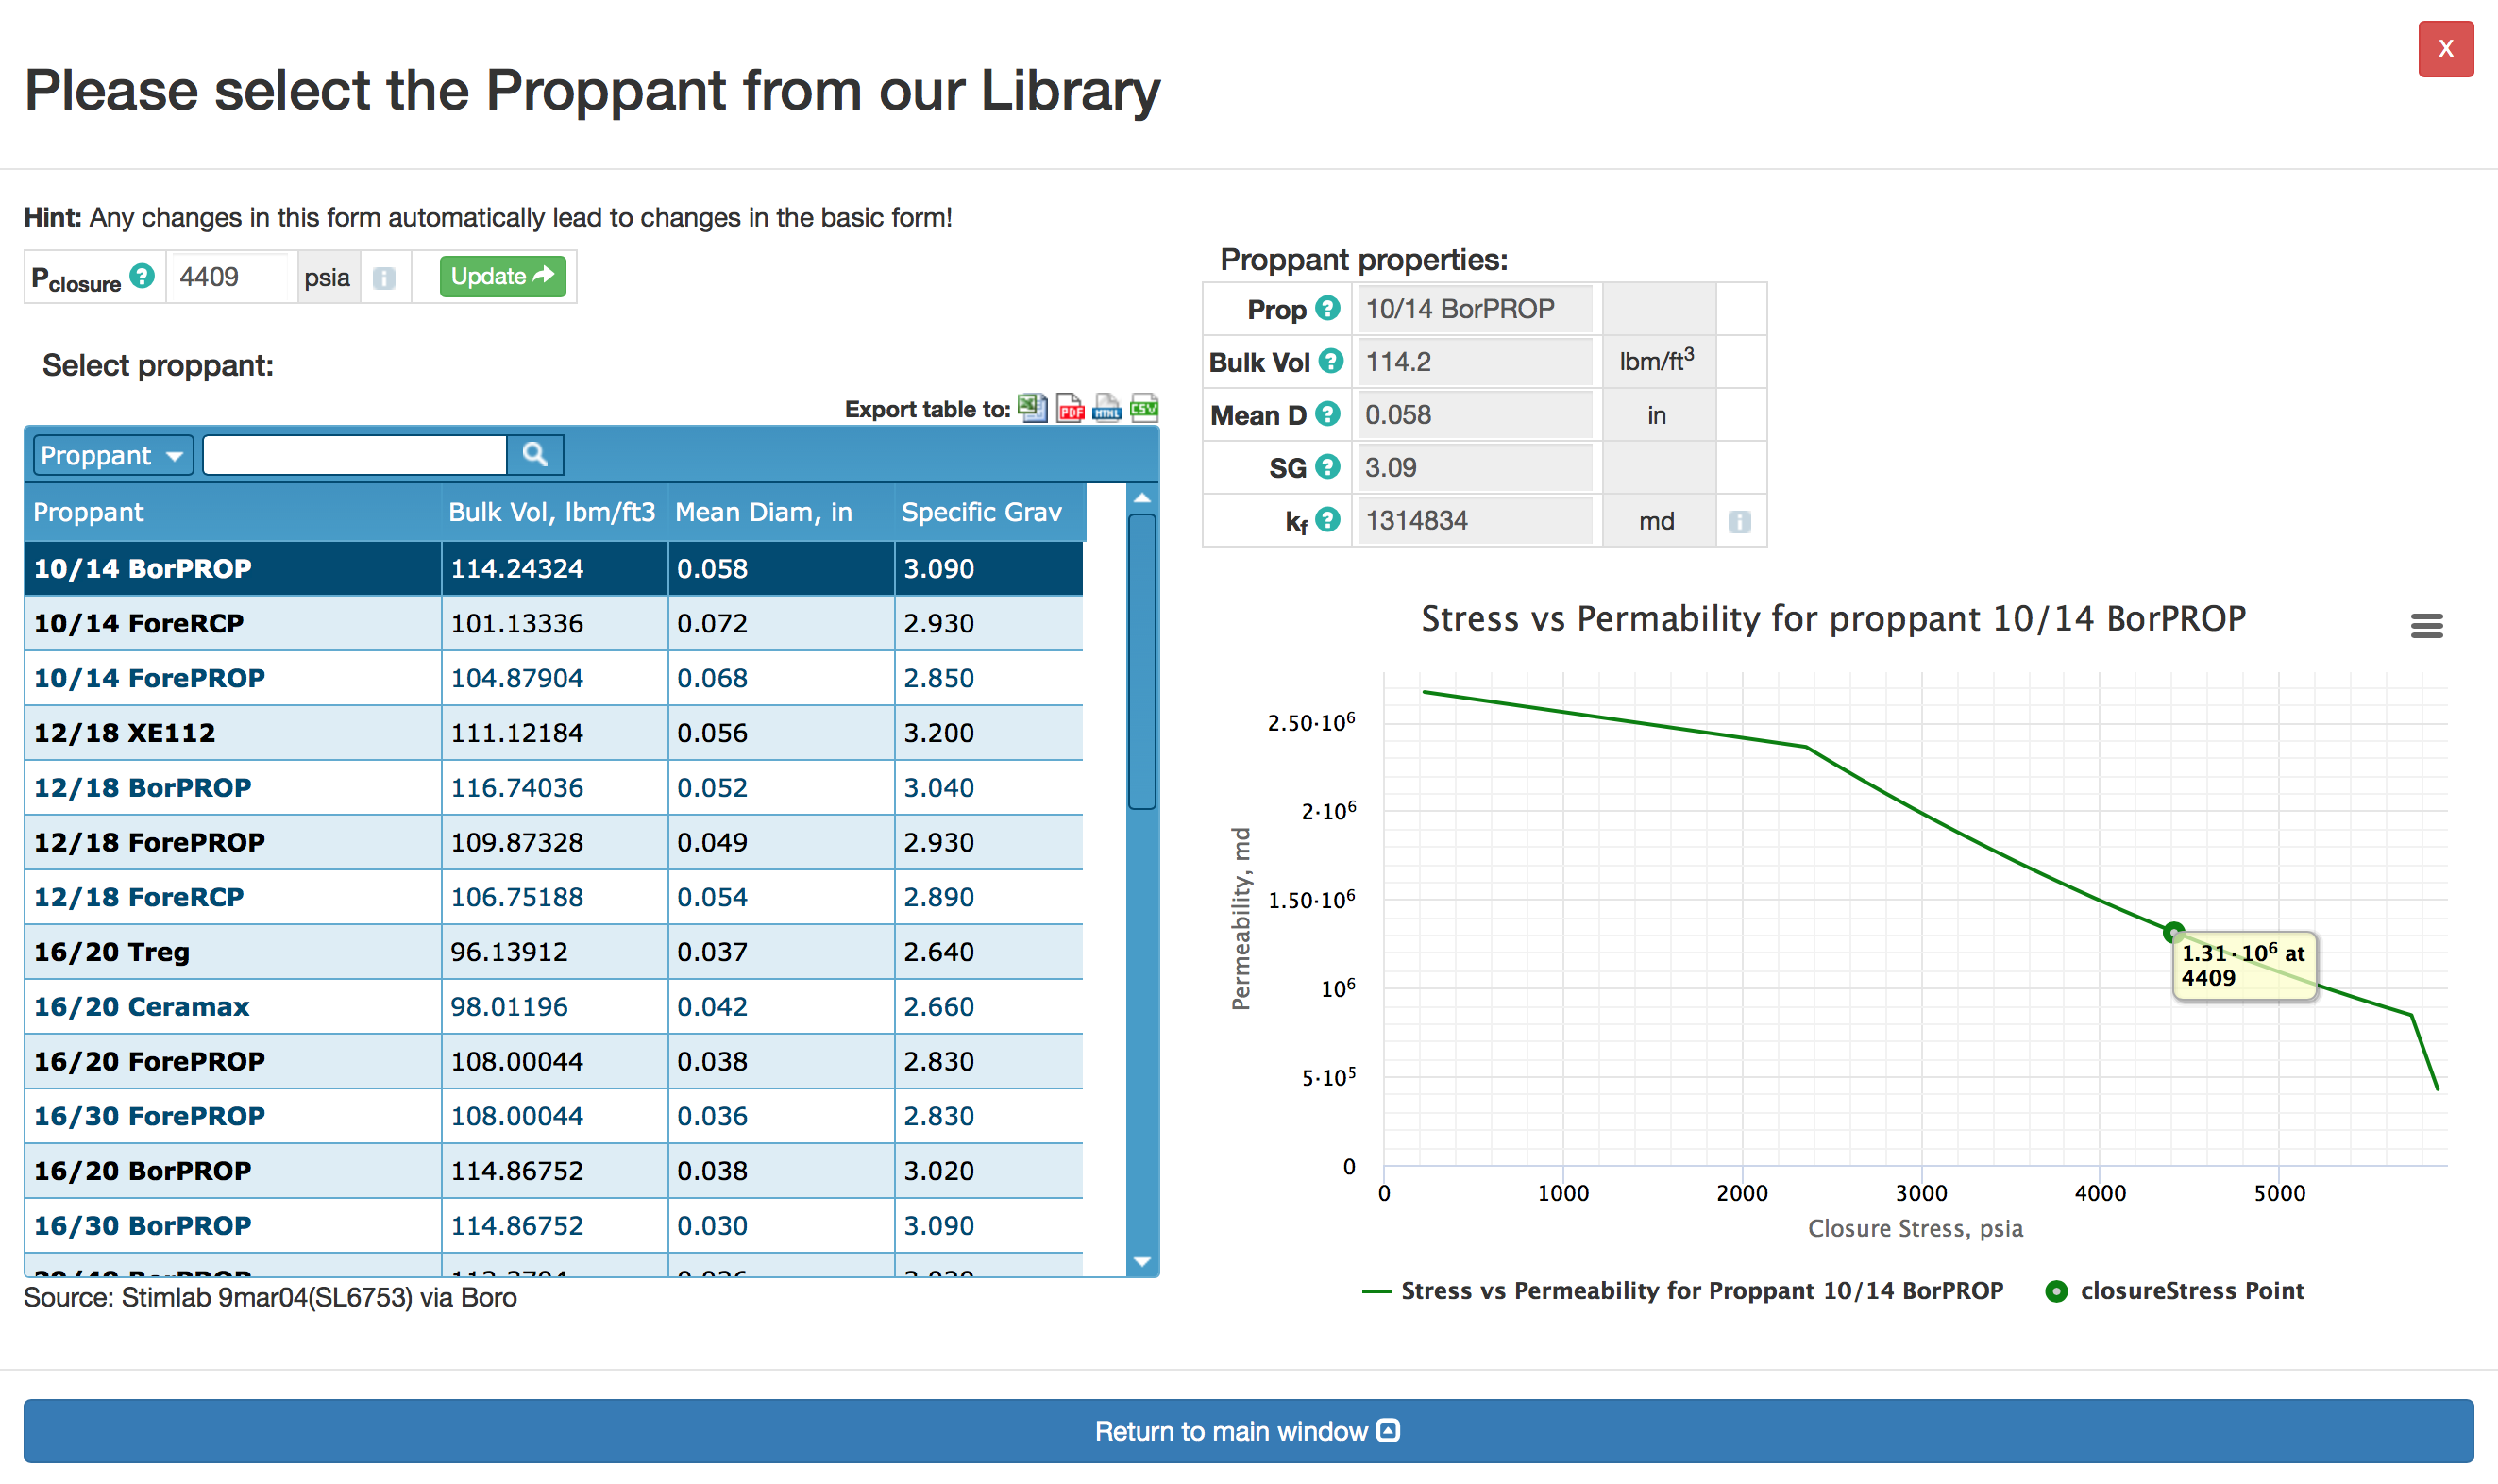
| 10:36, 23 July 2018 | Proppant catalog.png (file) |  |
257 KB | Proppant catalog in the www.pengtools.com | 1 |
| 08:12, 12 December 2022 | Can of Beans (Gas) video.png (file) | _video.png) |
255 KB | Can_of_Beans_(Gas)_video | 1 |
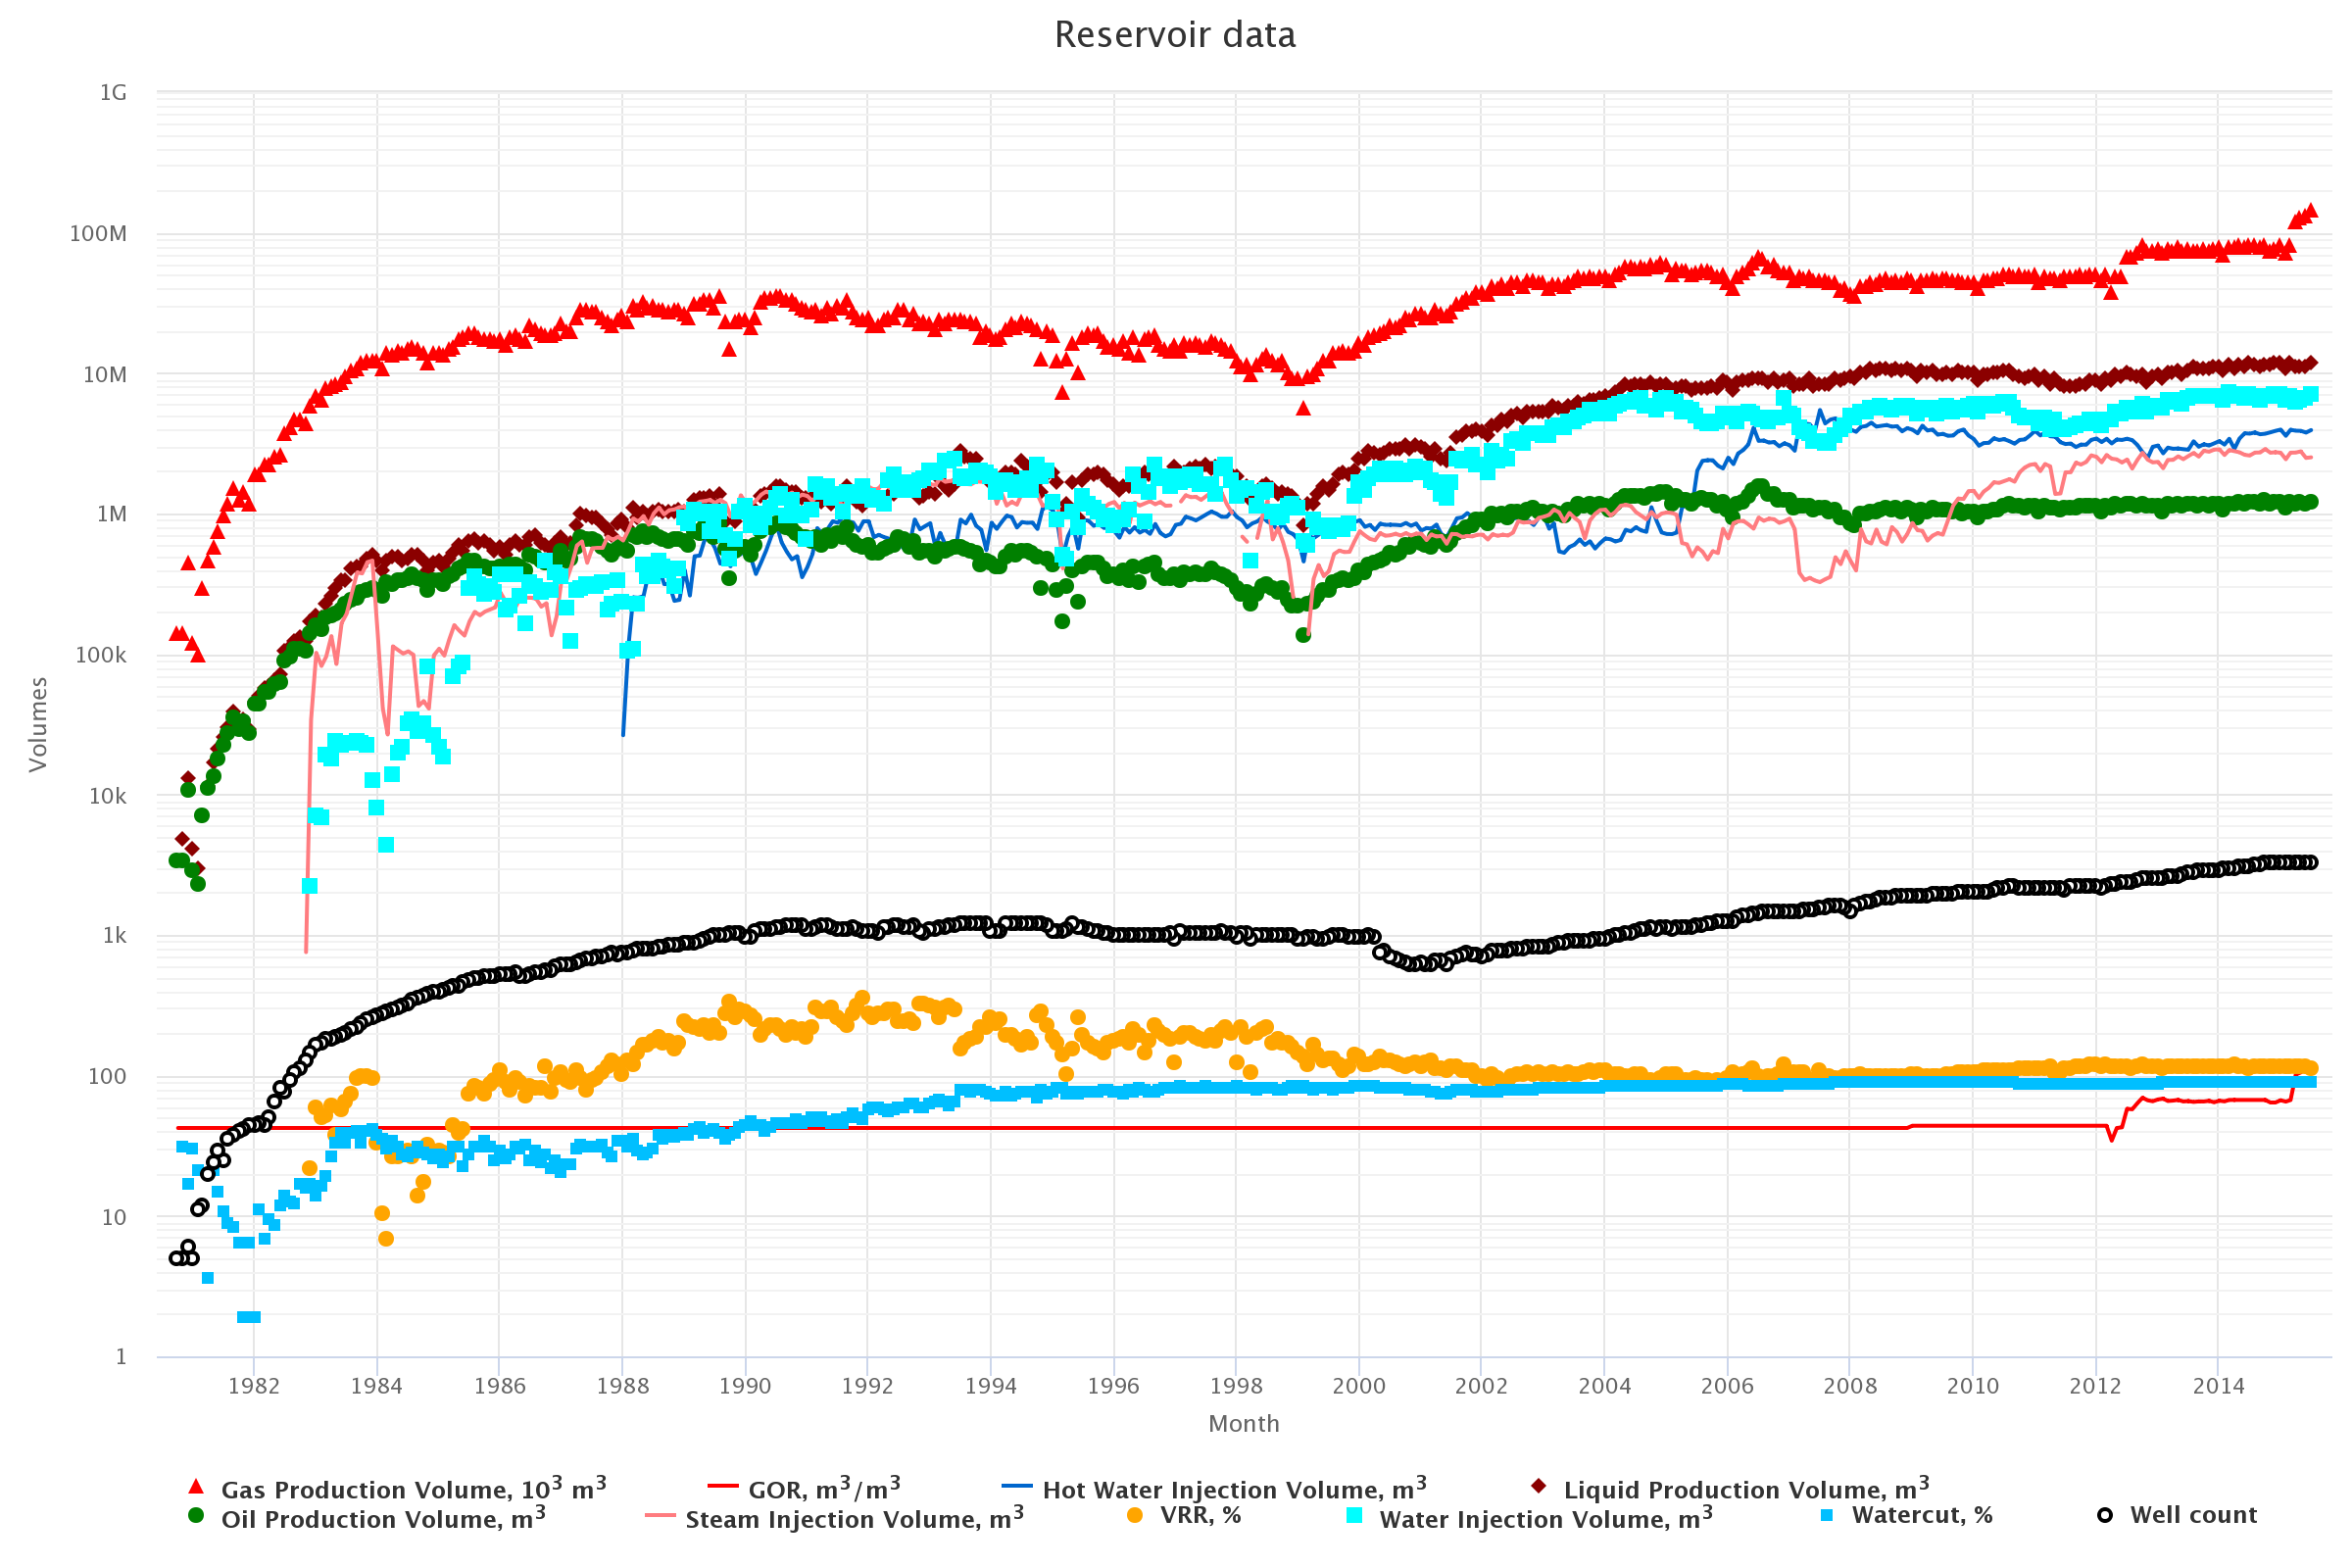
| 21:20, 3 February 2017 | History Plot.png (file) |  |
251 KB | 2 | |
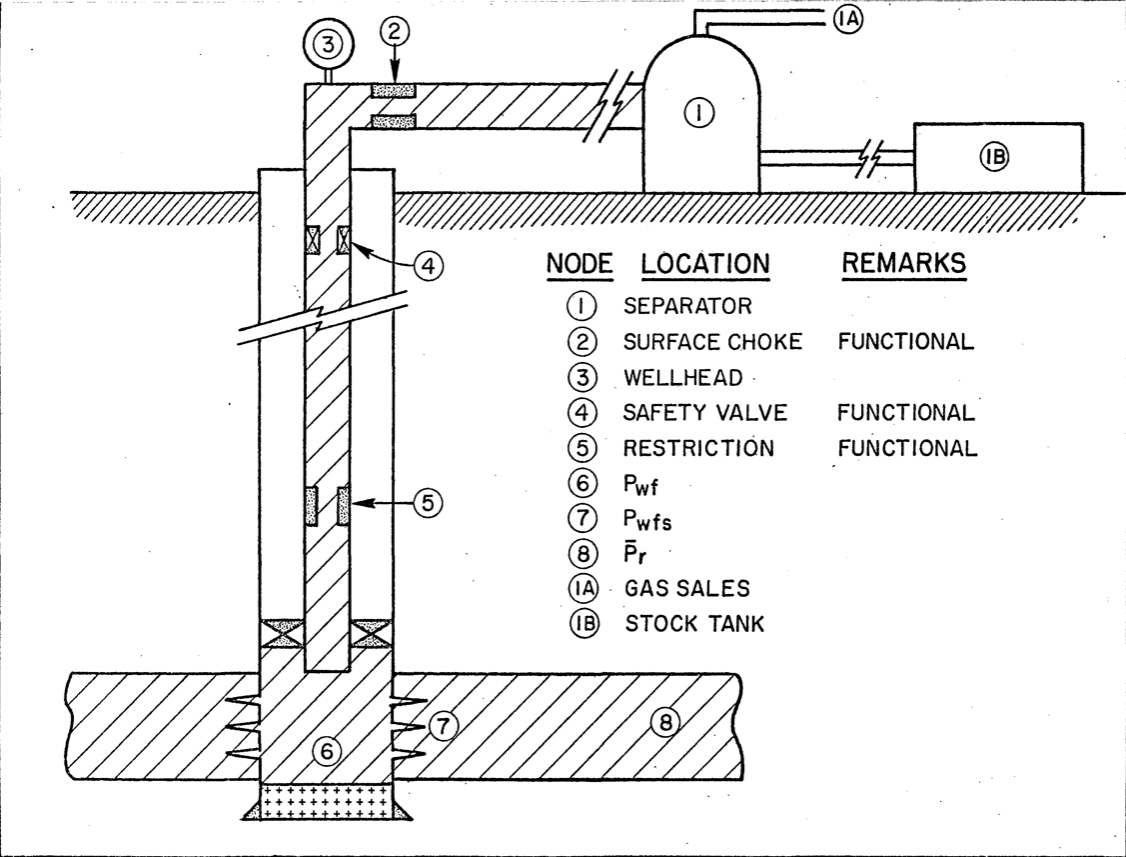
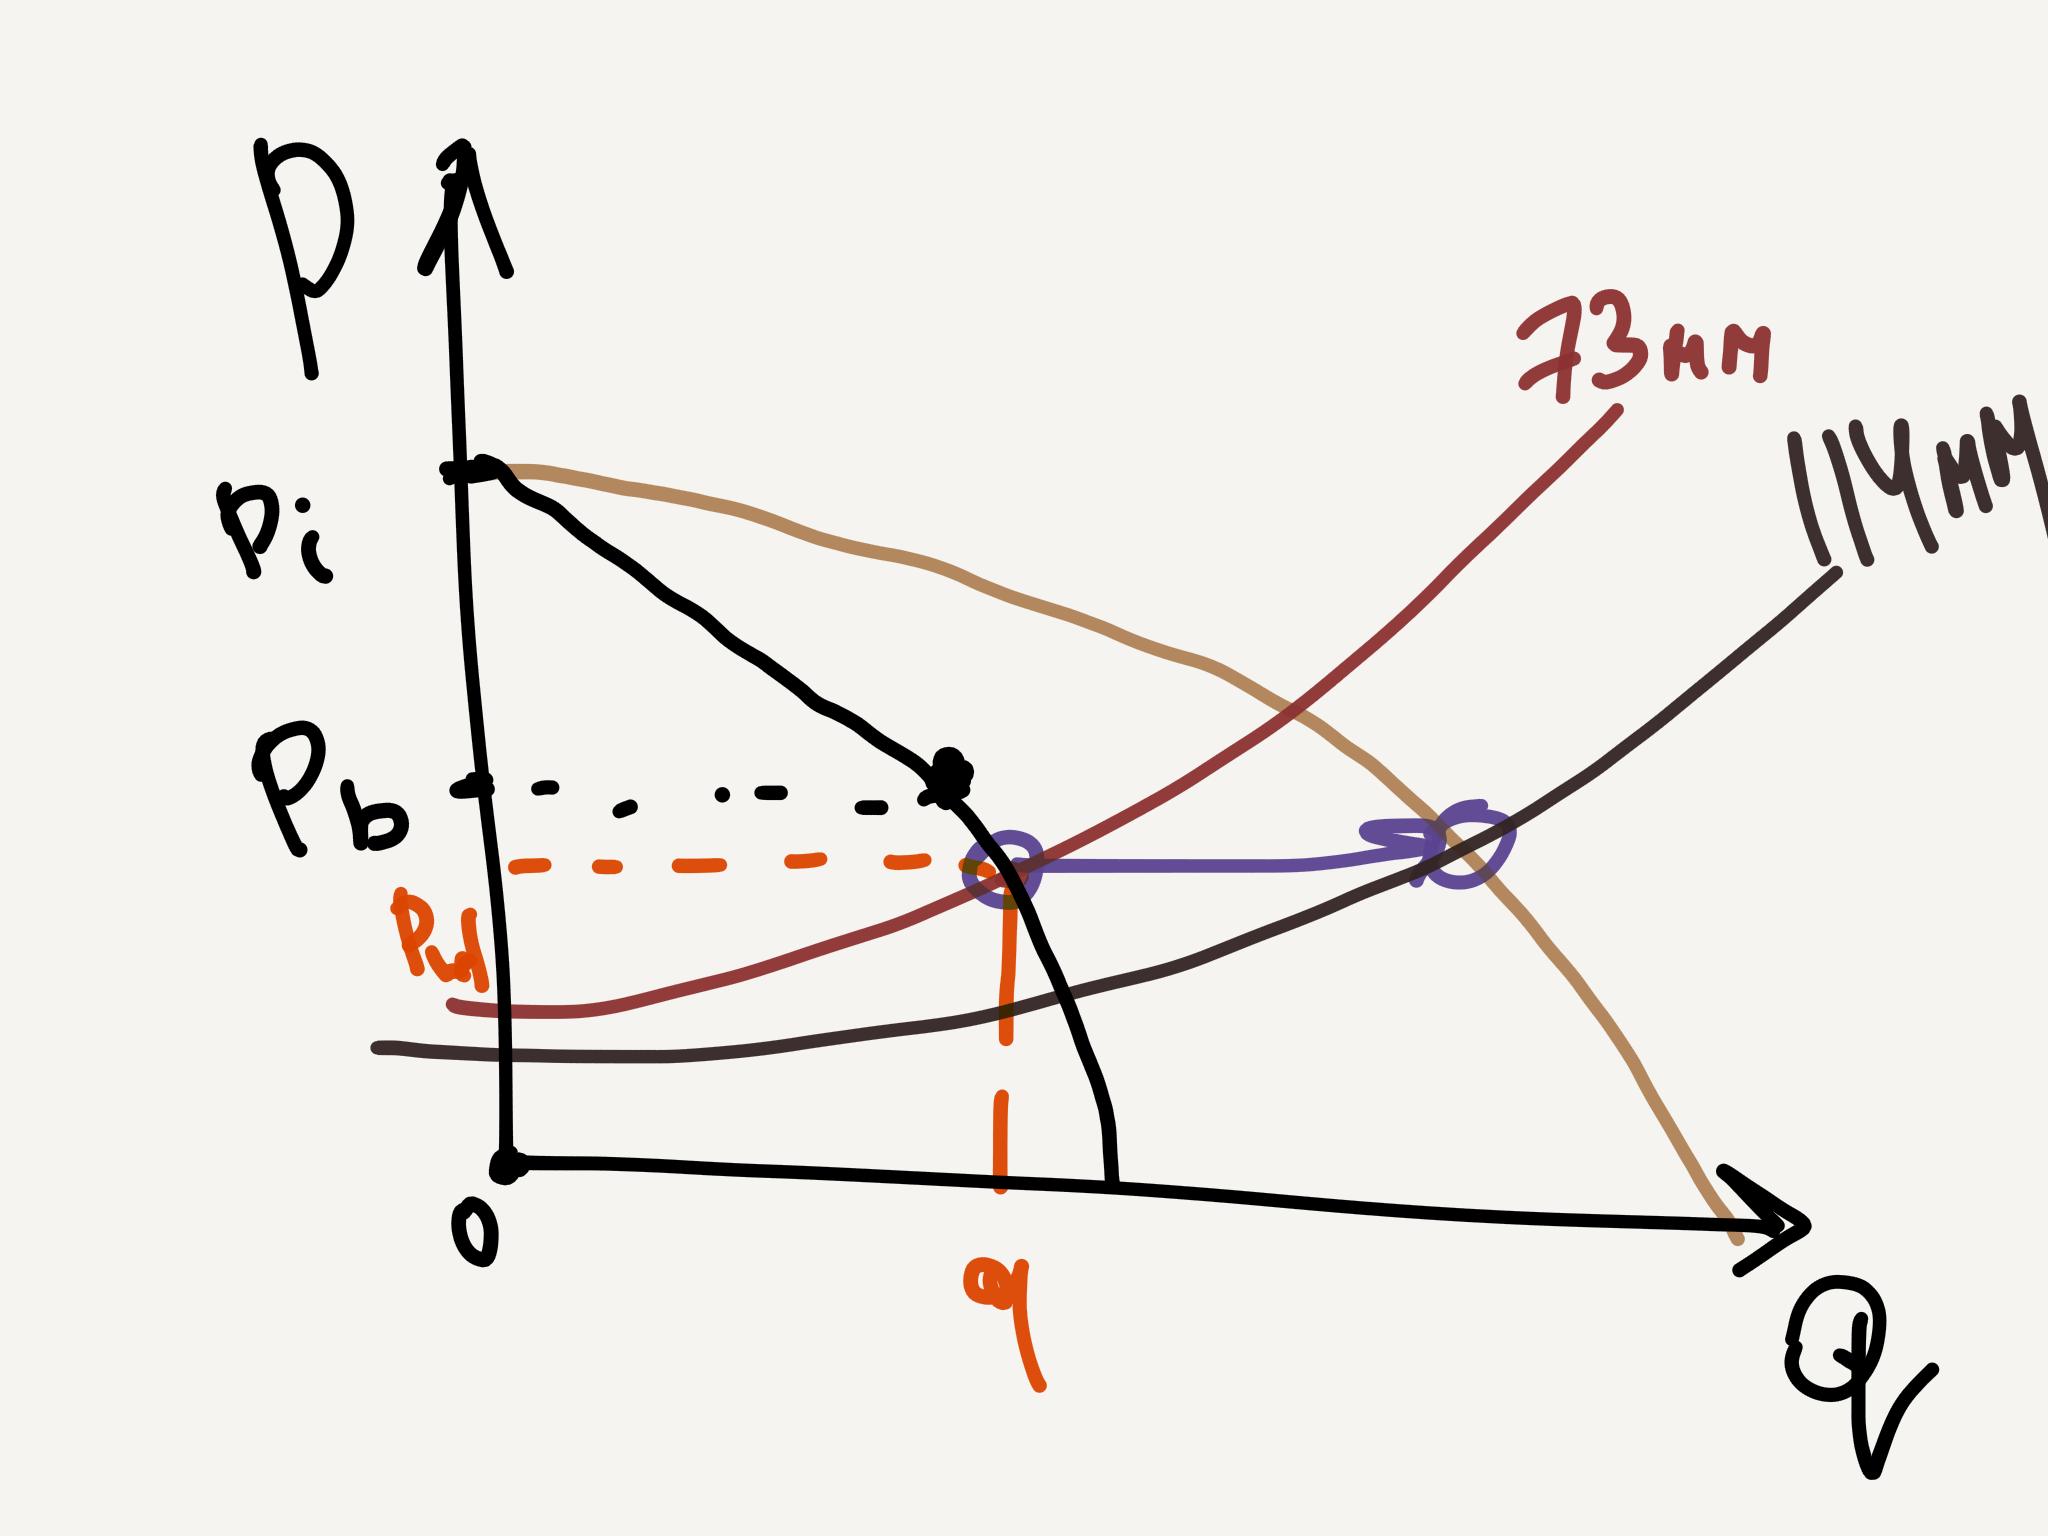
| 05:45, 30 May 2020 | Location of various nodes.png (file) |  |
240 KB | Location of various nodes | Well Nodal Analysis | 1 |
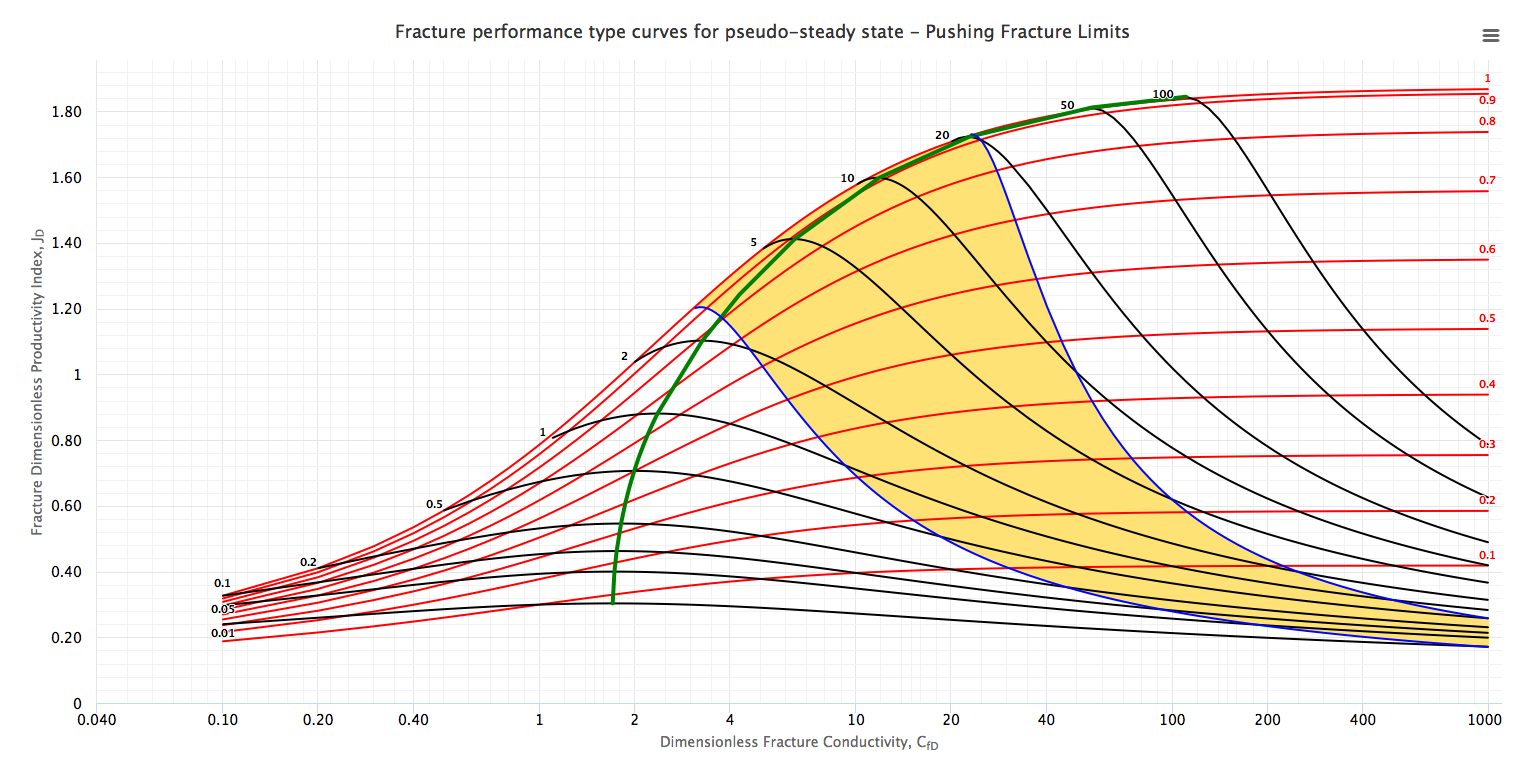
| 13:35, 16 August 2018 | Physical Constraints on a PSS type curve.png (file) |  |
239 KB | Physical Constraints on a PSS Type Curve | 1 |
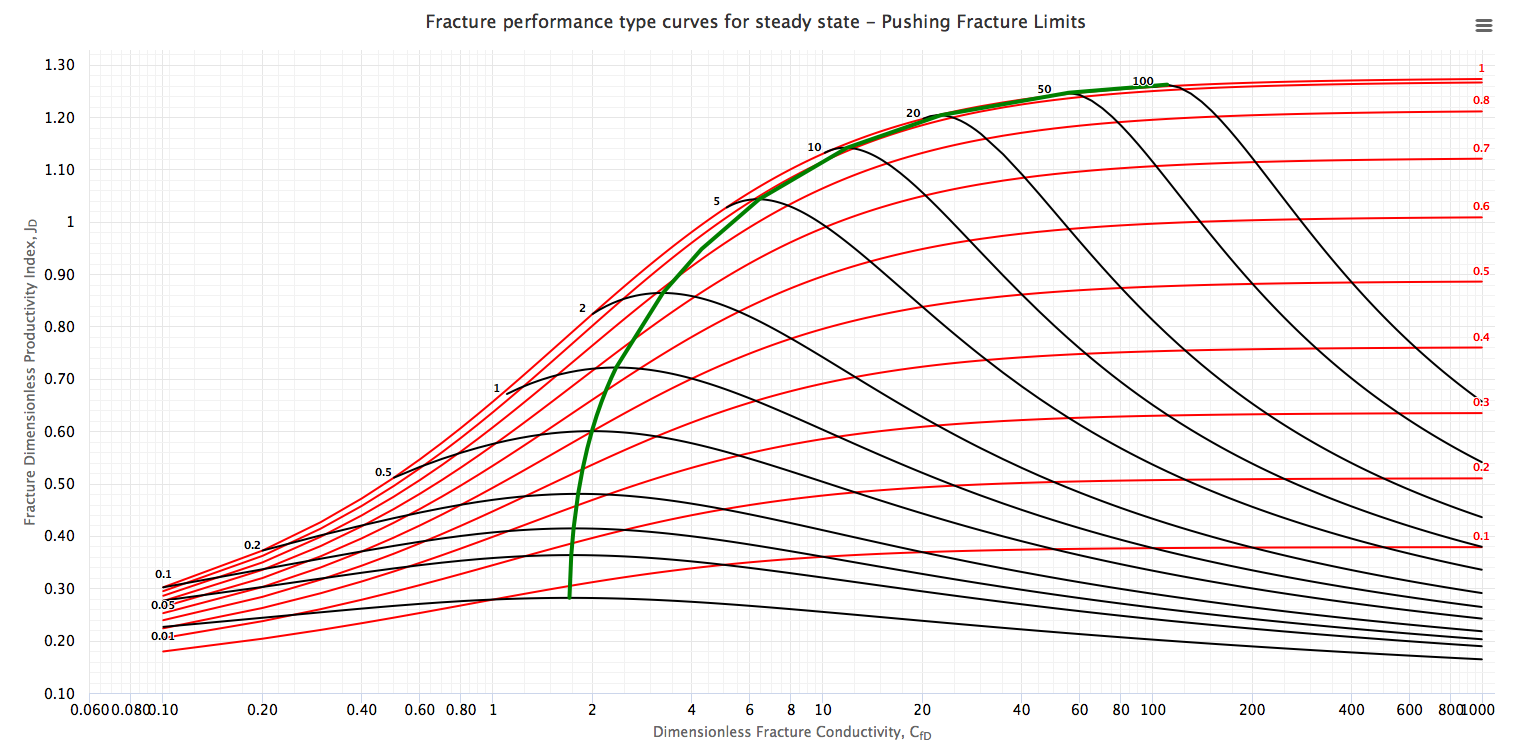
| 14:05, 14 August 2018 | Steady state type curve.png (file) |  |
239 KB | Steady state type curves | 1 |
| 15:38, 28 May 2020 | Well Nodal Analysis.png (file) |  |
237 KB | Well Nodal Analysis | 1 |
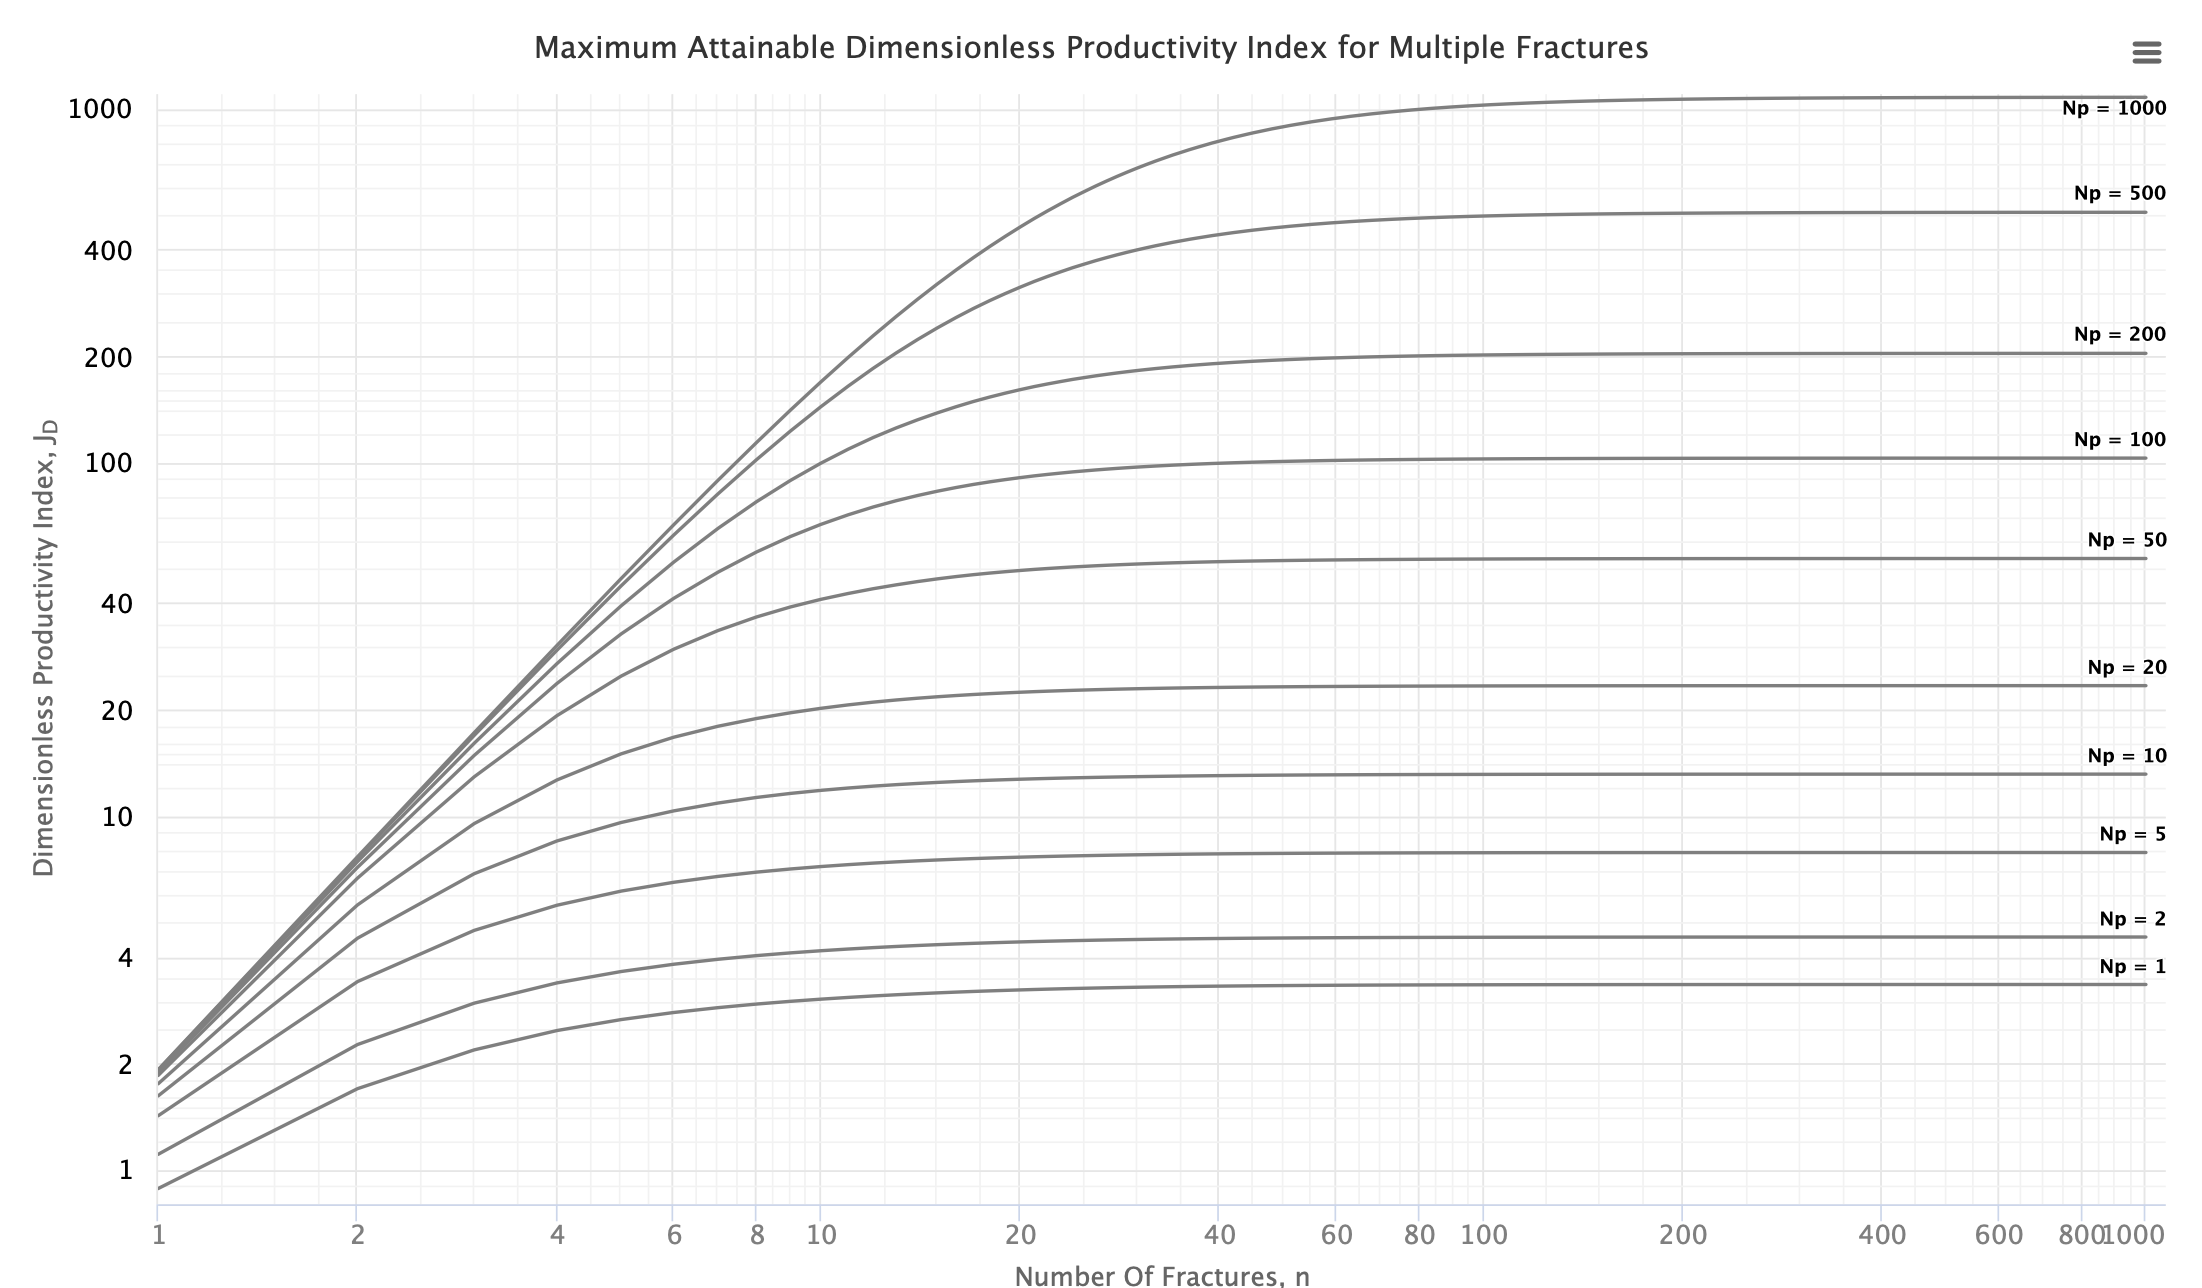
| 15:19, 11 July 2019 | Multistage fracturing type curve.png (file) |  |
237 KB | multistage fracturing type curve | 1 |
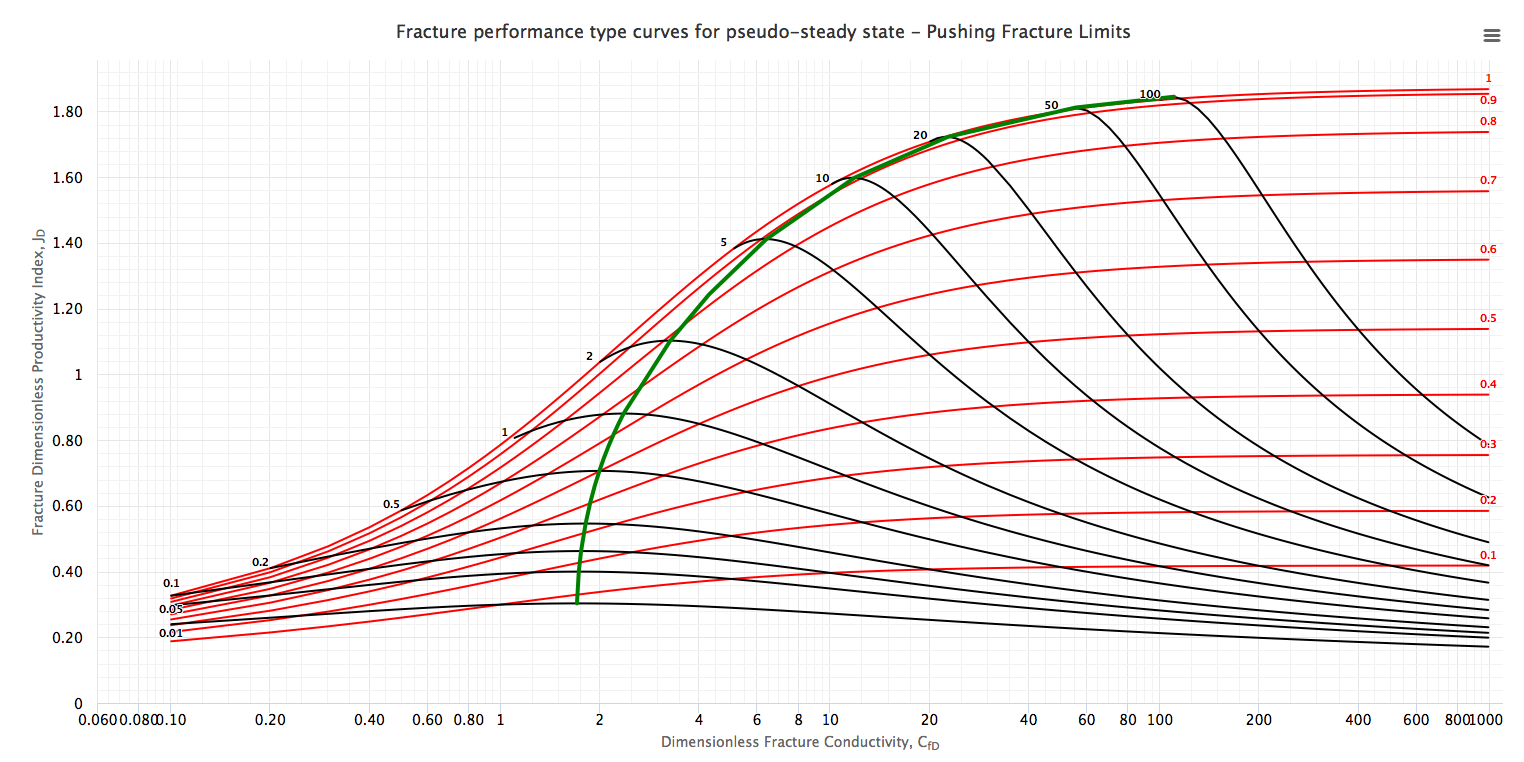
| 14:04, 14 August 2018 | Pseudo-steady state type curve.png (file) |  |
235 KB | Pseudo-steady state type curve | 1 |
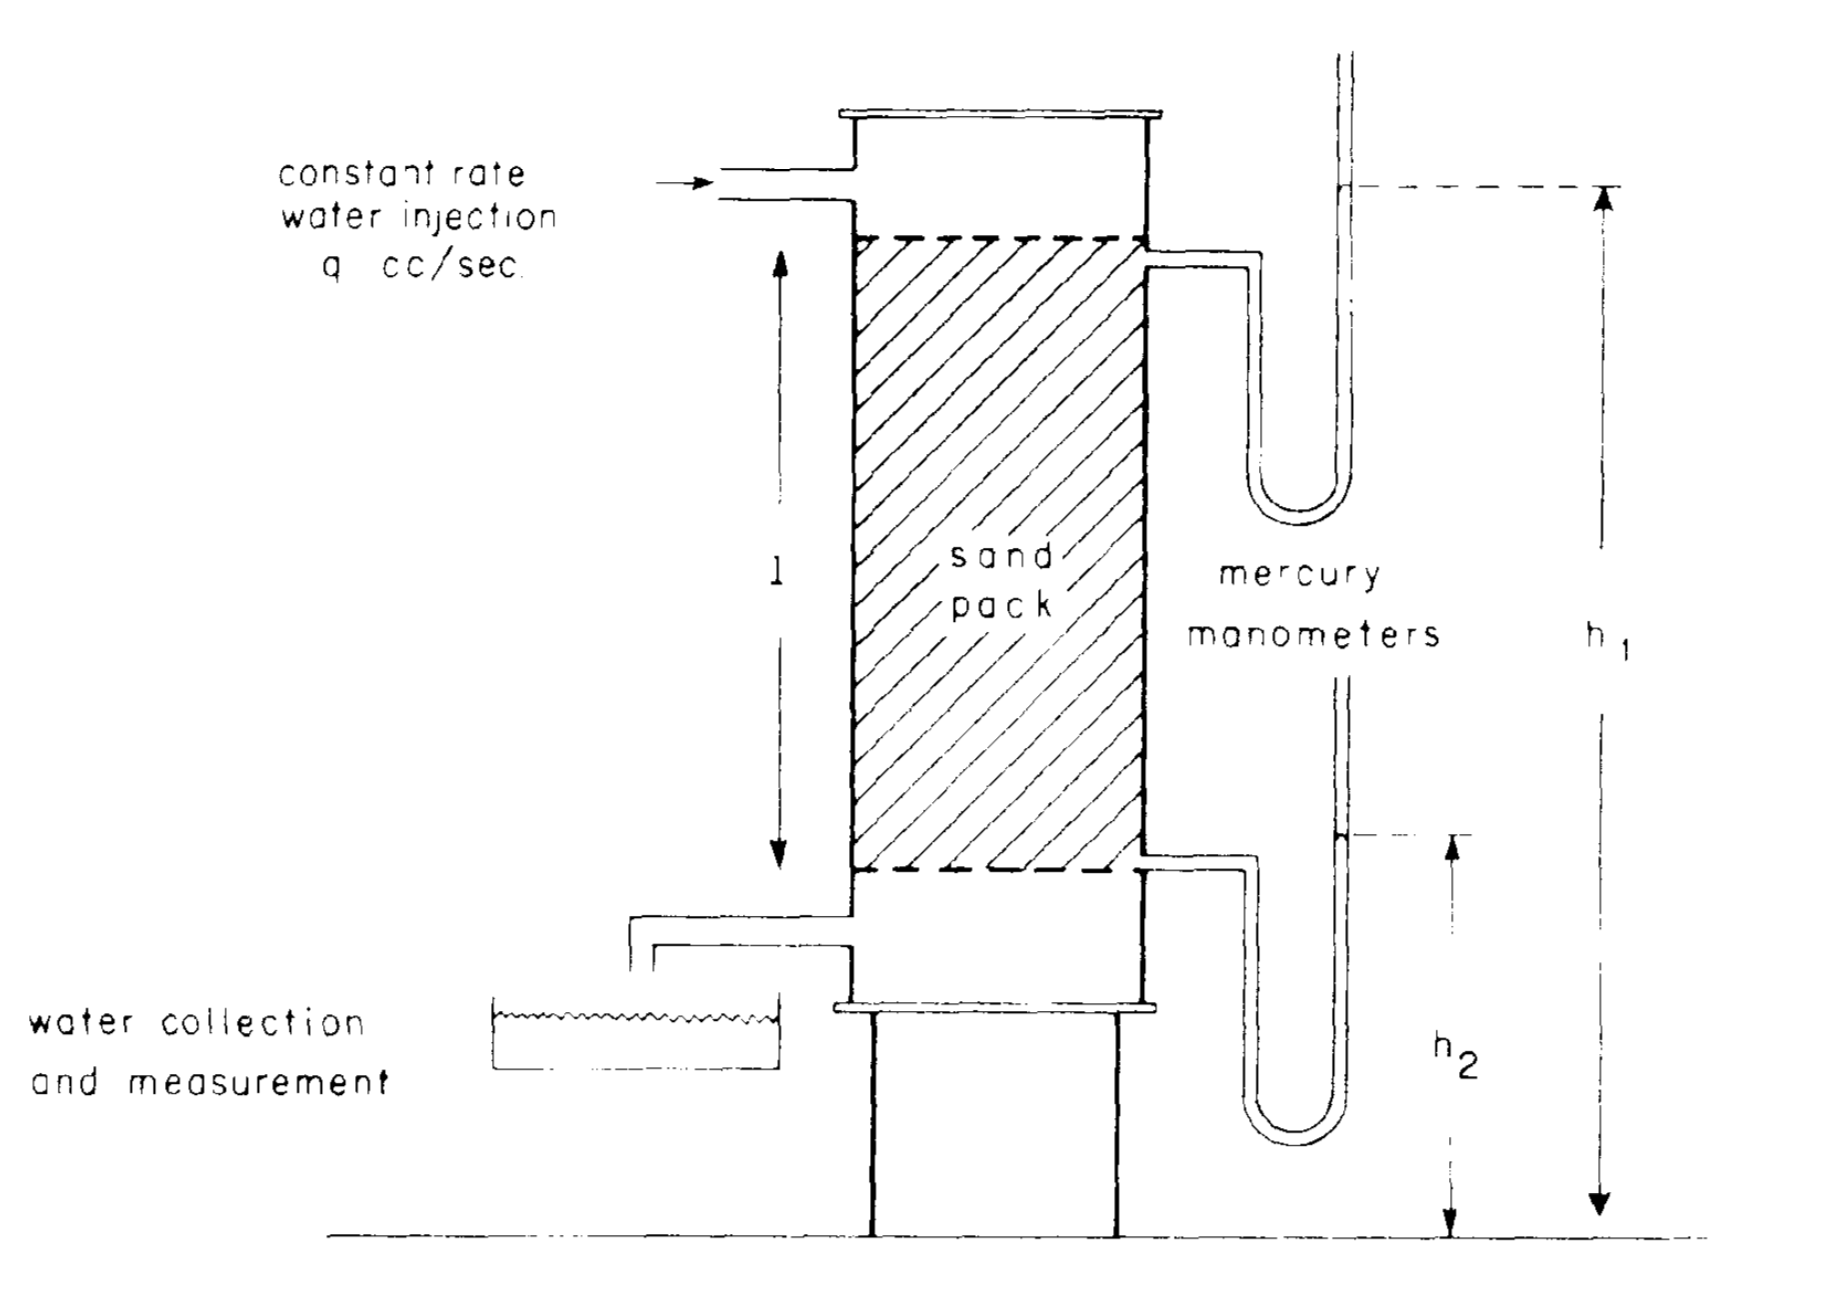
| 13:54, 22 July 2019 | Darcy's experimental equipment.png (file) |  |
213 KB | Darcy's experimental equipment | 1 |
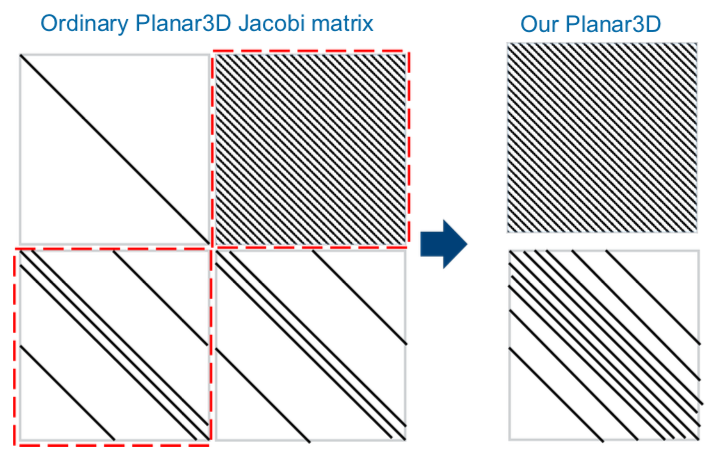
| 08:08, 8 October 2018 | Miptknowhow.png (file) |  |
208 KB | In usual numerical Planar3D implementation, Jacobi matrix in- cludes parts that describe geomechanical and hydrodynamical pro- cesses. Splitting by physical processes lets us solve geomechan- ics and hydrodynamics separately. Splitting turns one linear... | 1 |
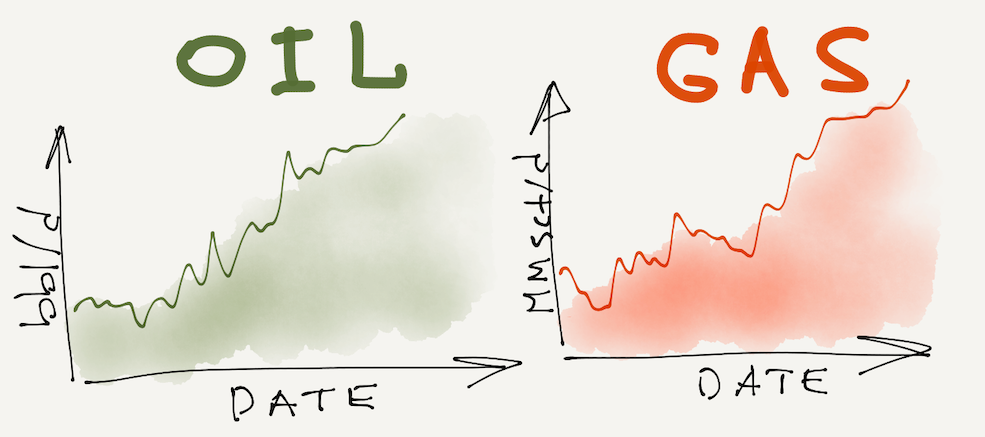
| 10:37, 14 December 2018 | Petroleum Engineering.png (file) |  |
198 KB | Petroleum Engineering is a process of maximizing oil and gas production. | 1 |
| 13:24, 18 April 2018 | Well 8 daily data.csv (file) | 192 KB | 1 | ||
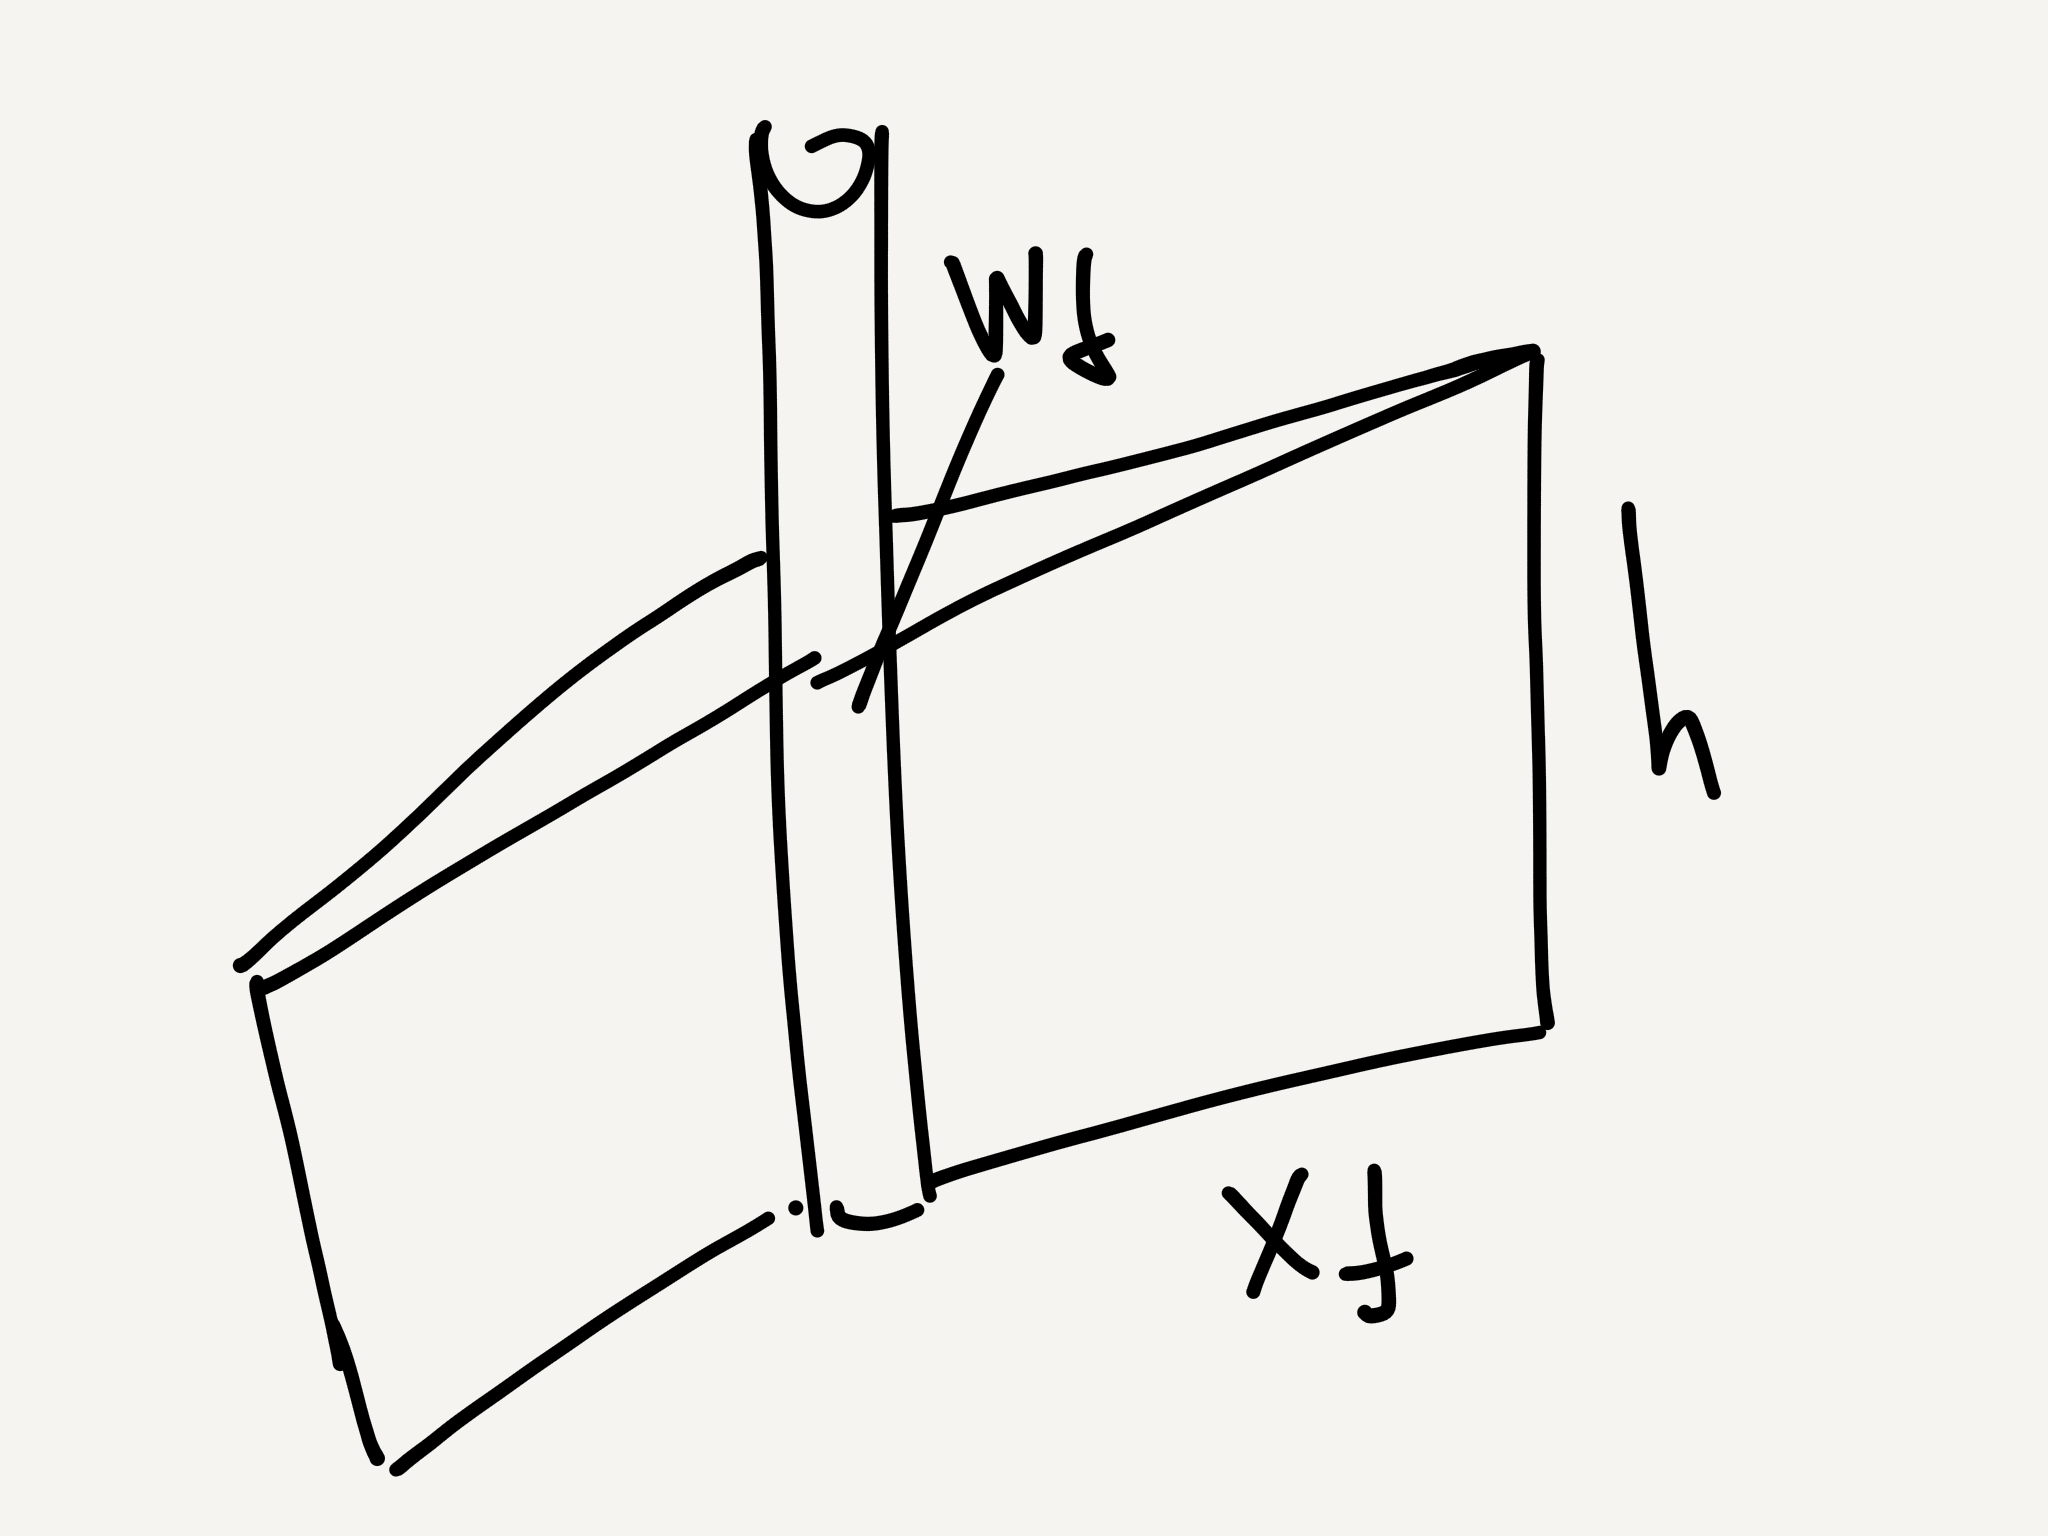
| 06:01, 10 December 2018 | Hydraulic fracturing.png (file) |  |
192 KB | Hydraulic fracturing | 1 |
| 11:33, 27 January 2017 | EnhancementListBlocks.png (file) |  |
177 KB | Block Enhancement List | 1 |
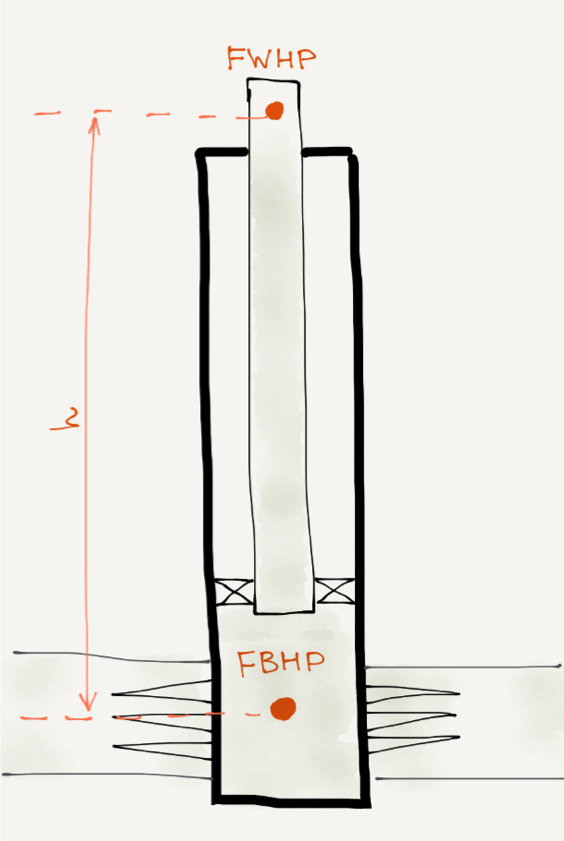
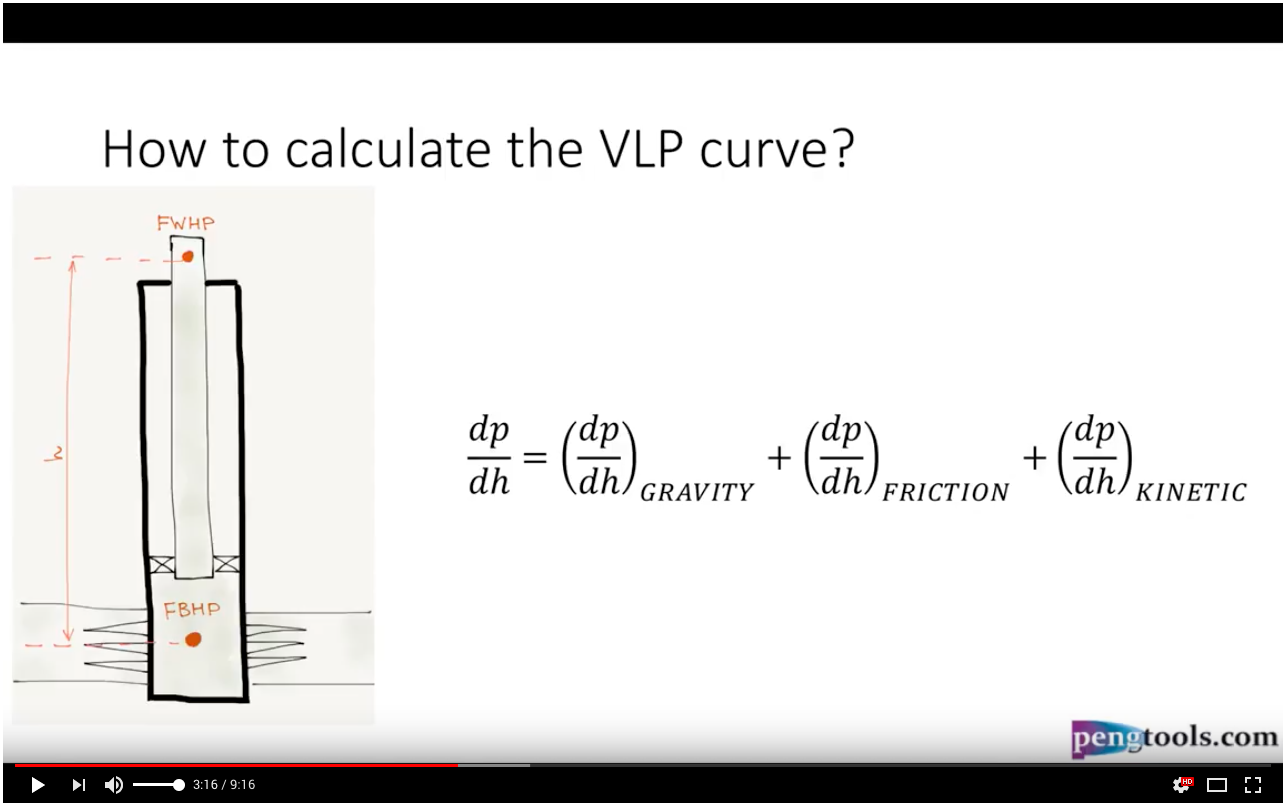
| 06:40, 27 April 2020 | VLP math.png (file) |  |
175 KB | Wellbore schematic for VLP calculation | 1 |
| 09:12, 6 December 2017 | DCA.gif (file) |  |
174 KB | Decline Curve Analysis | 1 |
| 17:54, 27 October 2017 | Measures Structure.png (file) |  |
173 KB | Drawing shows E&P Portal data structure | 1 |
| 21:18, 3 February 2017 | Reservoir Management.png (file) | 170 KB | 2 | ||
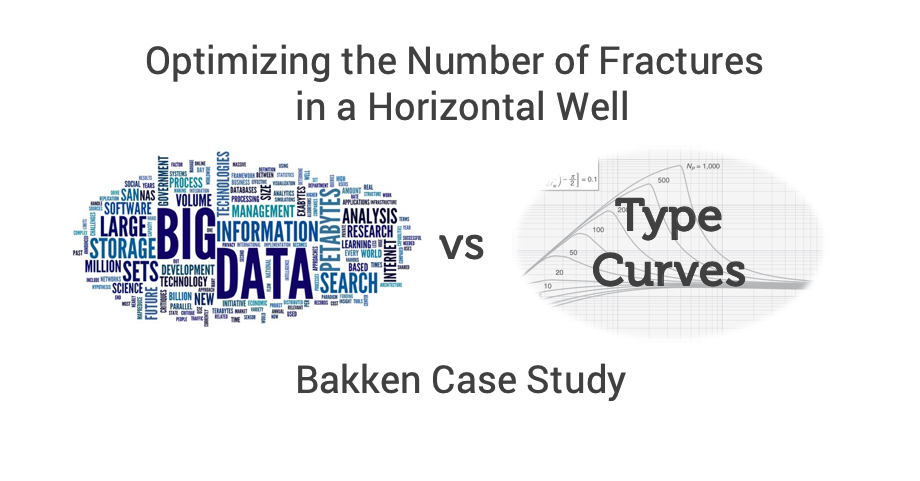
| 05:26, 22 November 2019 | Big Data vs Type Curves Bakken Case Study.png (file) |  |
170 KB | Big Data vs Type Curves Bakken Case Study | 1 |
| 09:46, 23 August 2018 | Hagedorn and Brown demo.png (file) |  |
164 KB | Hagedorn and Brown correlation overview | 1 |
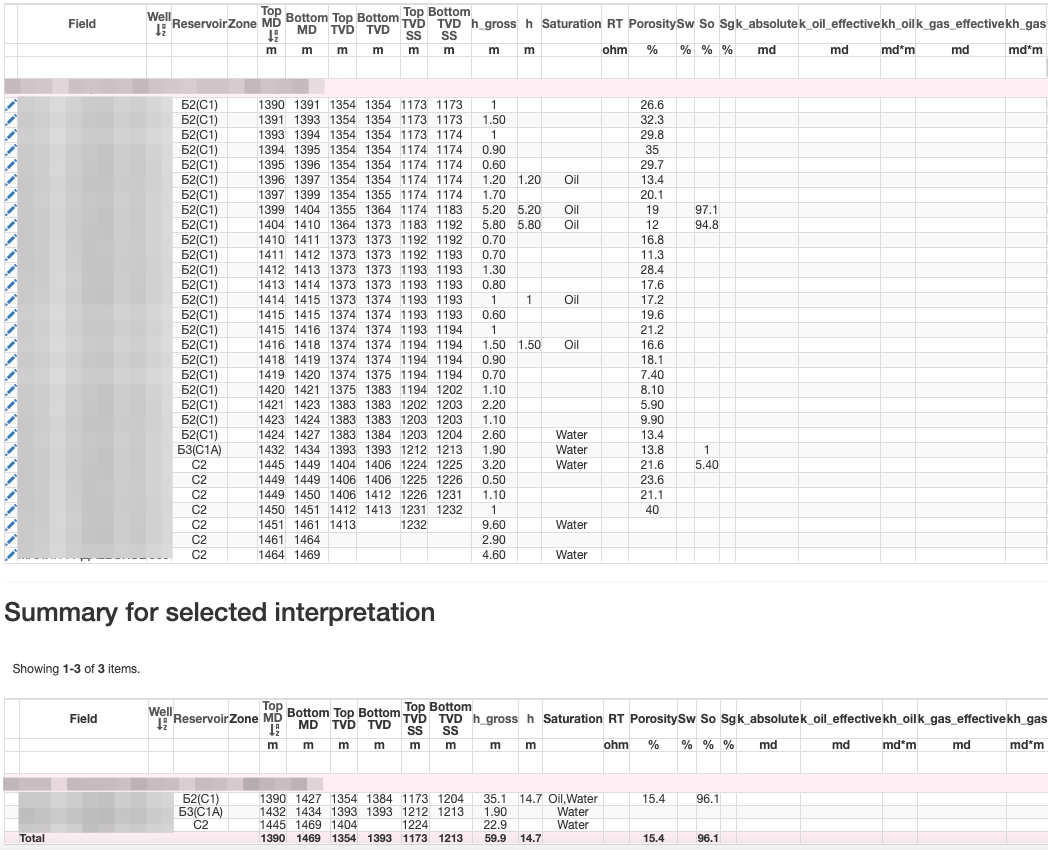
| 17:25, 2 April 2022 | Well Log Interpretation.png (file) |  |
155 KB | Well Log Interpretation | 2 |
| 07:38, 2 November 2018 | OnPlan main page.png (file) |  |
154 KB | hydraulic fracturing, onPlan main page screenshot | 1 |
First page |
Previous page |
Next page |
Last page |