File list
This special page shows all uploaded files.
First page |
Previous page |
Next page |
Last page |
| Date | Name | Thumbnail | Size | User | Description | Versions |
|---|---|---|---|---|---|---|
| 11:45, 17 October 2018 | Warpinski 3 Half-length.png (file) | 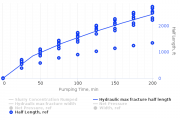 |
25 KB | MishaT | Warpinski_3_Half-length | 1 |
| 11:44, 17 October 2018 | Warpinski 3 Width.png (file) | 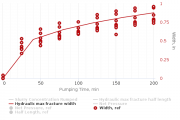 |
24 KB | MishaT | Warpinski_3_Width | 1 |
| 11:44, 17 October 2018 | Warpinski 3 Net Pressure.png (file) | 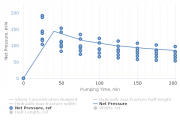 |
24 KB | MishaT | Warpinski_3_Net_Pressure | 1 |
| 11:43, 17 October 2018 | Warpinski 2 Width.png (file) | 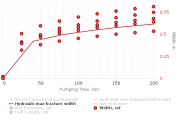 |
23 KB | MishaT | Warpinski_2_Width | 1 |
| 11:43, 17 October 2018 | Warpinski 2 Half-length.png (file) | 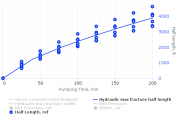 |
25 KB | MishaT | Warpinski_2_Half-length | 1 |
| 11:34, 17 October 2018 | Warpinski 2 Net Pressure.png (file) | 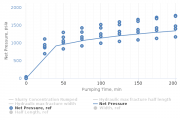 |
22 KB | MishaT | Warpinski_2_Net_Pressure | 1 |
| 11:33, 17 October 2018 | Warpinski 1 Width.png (file) | 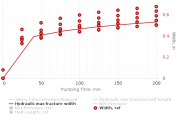 |
23 KB | MishaT | Warpinski_1_Width | 1 |
| 11:33, 17 October 2018 | Warpinski 1 Half-length.png (file) | 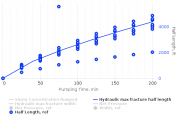 |
24 KB | MishaT | Warpinski_1_Half-length | 1 |
| 11:33, 17 October 2018 | Warpinski 1 Net Pressure.png (file) | 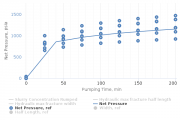 |
22 KB | MishaT | Warpinski_1_Net_Pressure | 1 |
| 09:45, 16 October 2018 | Weng Fluid Efficiency.png (file) |  |
114 KB | MishaT | 1 | |
| 09:44, 16 October 2018 | Weng Half-length.png (file) |  |
111 KB | MishaT | 1 | |
| 09:44, 16 October 2018 | Weng Net Pressure.png (file) |  |
112 KB | MishaT | 2 | |
| 08:14, 12 October 2018 | FracDesign simulation mode flow diagram.png (file) | 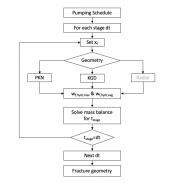 |
41 KB | MishaT | fracDesign simulation mode flow diagram | 1 |
| 07:26, 12 October 2018 | FracDesign design mode flow diagram.png (file) | 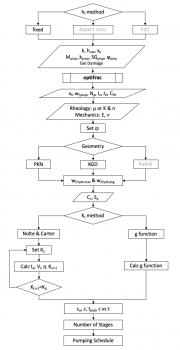 |
83 KB | MishaT | FracDesign design mode flow diagram | 1 |
| 10:36, 10 October 2018 | Fracturenotation.png (file) | 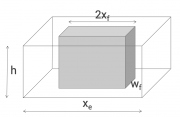 |
31 KB | MishaT | 2 | |
| 10:35, 10 October 2018 | OptiFrac flow diagram.png (file) | 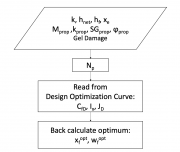 |
81 KB | MishaT | 3 | |
| 08:29, 8 October 2018 | Ilia Perepechkin.jpg (file) |  |
87 KB | MishaT | Ilia Perepechkin business card | 1 |
| 08:28, 8 October 2018 | Natalia Zavialova.jpg (file) |  |
58 KB | MishaT | Natalia Zavialova business card | 1 |
| 08:08, 8 October 2018 | Miptknowhow.png (file) | 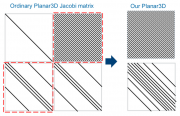 |
208 KB | MishaT | In usual numerical Planar3D implementation, Jacobi matrix in- cludes parts that describe geomechanical and hydrodynamical pro- cesses. Splitting by physical processes lets us solve geomechan- ics and hydrodynamics separately. Splitting turns one linear... | 1 |
| 06:05, 8 October 2018 | OnPlan i.png (file) |  |
32 KB | MishaT | onPlan logo | 1 |
| 09:16, 10 September 2018 | Fracture linear flow.png (file) | 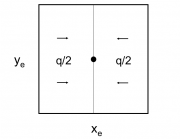 |
11 KB | MishaT | stimulated well drainage | 2 |
| 09:48, 23 August 2018 | Hagedorn and Brown ppt.pdf (file) | 1.47 MB | MishaT | Hagedorn and Brown correlation overview presentation | 1 | |
| 09:46, 23 August 2018 | Hagedorn and Brown demo.png (file) |  |
164 KB | MishaT | Hagedorn and Brown correlation overview | 1 |
| 12:14, 17 August 2018 | FracDesign i.png (file) |  |
28 KB | MishaT | fracDesign logo | 1 |
| 14:31, 16 August 2018 | Fracturedimensions.png (file) | 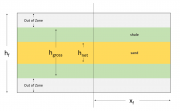 |
26 KB | MishaT | Fracture Dimensions | 1 |
| 13:35, 16 August 2018 | Physical Constraints on a PSS type curve.png (file) |  |
239 KB | MishaT | Physical Constraints on a PSS Type Curve | 1 |
| 14:05, 14 August 2018 | Steady state type curve.png (file) |  |
239 KB | MishaT | Steady state type curves | 1 |
| 14:04, 14 August 2018 | Pseudo-steady state type curve.png (file) |  |
235 KB | MishaT | Pseudo-steady state type curve | 1 |
| 15:53, 9 August 2018 | PhaseD i.png (file) |  |
54 KB | MishaT | PhaseD logo | 1 |
| 15:09, 9 August 2018 | PQplot demo.png (file) | 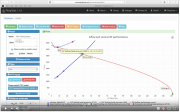 |
1.05 MB | MishaT | This video demonstrates basic functionality of the PVT and PQplot tools | 1 |
| 17:45, 8 August 2018 | Pengtools.png (file) | 27 KB | MishaT | pengtools logo | 1 | |
| 17:28, 8 August 2018 | PVT demo.png (file) | 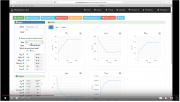 |
709 KB | MishaT | pengtools.com PVT demo at youtube.com | 1 |
| 14:22, 31 July 2018 | Enhancement Tracking attacments.zip (file) | 813 KB | MishaT | Attachments: 1. “Huron 9 Pump Design Report.pdf”. 2. “Huron 9 Frac Design Report.pdf”. 3. “Huron 9 ESP upgrade Report.pdf”. 4. “Huron wells.csv”. 5. “Huron wells daily measures.csv”. 6. “Huron wells production forecast data.csv... | 1 | |
| 13:32, 31 July 2018 | Enhancement Tracking CaseStudy.pdf (file) | 9.51 MB | MishaT | This Case Study demonstrates the application of the Enhancement Tracking workflow using the E&P Portal. The Study is based on the enhancement campaign implemented in an oil field located in Siberia, Russia. The campaign included such Enhancements as f... | 1 | |
| 13:30, 31 July 2018 | Enhancment Tracking Case Study.png (file) | 508 KB | MishaT | Enhancement Tracking Case Study title page | 2 | |
| 13:13, 31 July 2018 | Enhancement List.jpeg (file) |  |
364 KB | MishaT | Well Enhancement List at E&P Portal | 1 |
| 13:10, 31 July 2018 | Scorpion plot E&P.png (file) |  |
119 KB | MishaT | Scorpion Plot at E&P Portal | 2 |
| 12:21, 28 July 2018 | Scorpion plot.png (file) |  |
290 KB | MishaT | Scorpion plot Innovator 12, TNK-BP Technology Magazine EN only | 2 |
| 12:12, 28 July 2018 | Enhancement Tracking.png (file) | 1.46 MB | MishaT | Enhancement Tracking Innovator 12, TNK-BP Technology Magazine EN only | 2 | |
| 10:36, 23 July 2018 | Proppant catalog.png (file) |  |
257 KB | MishaT | Proppant catalog in the www.pengtools.com | 1 |
| 12:51, 11 July 2018 | Production Potental.png (file) | 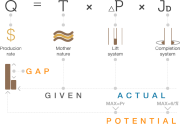 |
22 KB | MishaT | Production Potential | 1 |
| 11:35, 10 July 2018 | Enhancement ESP.png (file) |  |
128 KB | MishaT | Enhancement example: Converting the flowing well to the ESP (bbls) | 2 |
| 15:03, 29 May 2018 | Reciprocal Rate Method Example 3.png (file) | 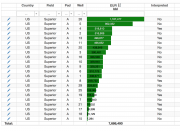 |
121 KB | MishaT | EUR results table for 22 wells. Automatically interpreted wells have "No" flag, manually interpreted "Yes" flag in the last column | 1 |
| 12:17, 29 May 2018 | Reciprocal Rate Method Example 4.png (file) |  |
79 KB | MishaT | Reciprocal Rate Method Example 4 "B2" reservoir Reciprocal Rate Method plot showing the Reservoir EUR spread. | 1 |
| 11:44, 29 May 2018 | Reciprocal Rate Method Example 2.png (file) |  |
69 KB | MishaT | Reciprocal Rate Method Example 2: Well "21" refrac doubles the EUR as indicated by the slope change | 1 |
| 11:34, 29 May 2018 | Reciprocal Rate Method Example 1.png (file) |  |
72 KB | MishaT | Reciprocal Rate Method Example 1 23 wells on the Reciprocal Rate Method plot showing the EUR data spread. Well 19 trend is highlighted. | 1 |
| 17:00, 28 May 2018 | ReciprocalRateMethod.png (file) |  |
71 KB | MishaT | Reciprocal Rate Method on E&P Portal | 1 |
| 08:40, 10 May 2018 | ESPcatalog.png (file) | 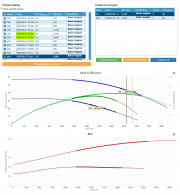 |
139 KB | MishaT | 1 | |
| 07:54, 10 May 2018 | Tornadochart.png (file) | 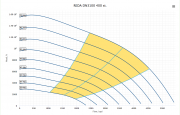 |
99 KB | MishaT | Example of tornado chart for the REDA DN3100 pump at 400 stages | 1 |
| 13:20, 4 May 2018 | PumpDesign i.png (file) |  |
50 KB | MishaT | Pump Design Logo | 1 |
First page |
Previous page |
Next page |
Last page |