File list
This special page shows all uploaded files.
First page |
Previous page |
Next page |
Last page |
| Date | Name | Thumbnail | Size | Description | Versions |
|---|---|---|---|---|---|
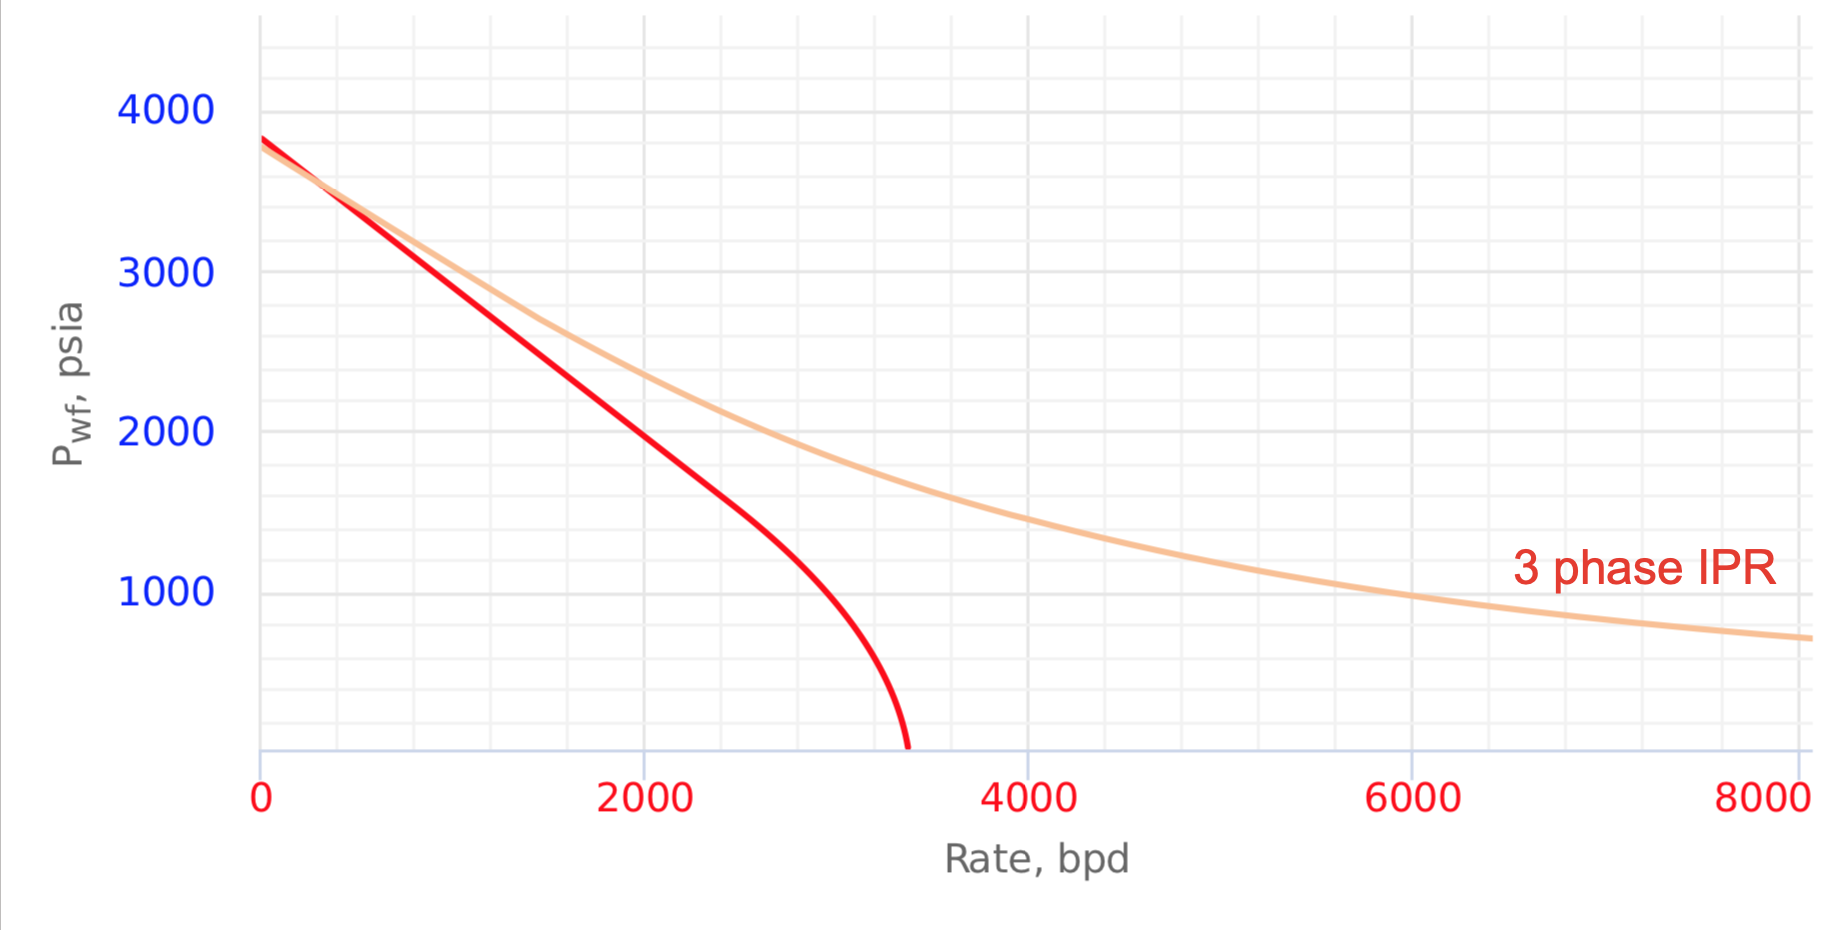
| 06:45, 17 April 2019 | 3 Phase IPR Curve.png (file) |  |
102 KB | 3 Phase IPR | 2 |
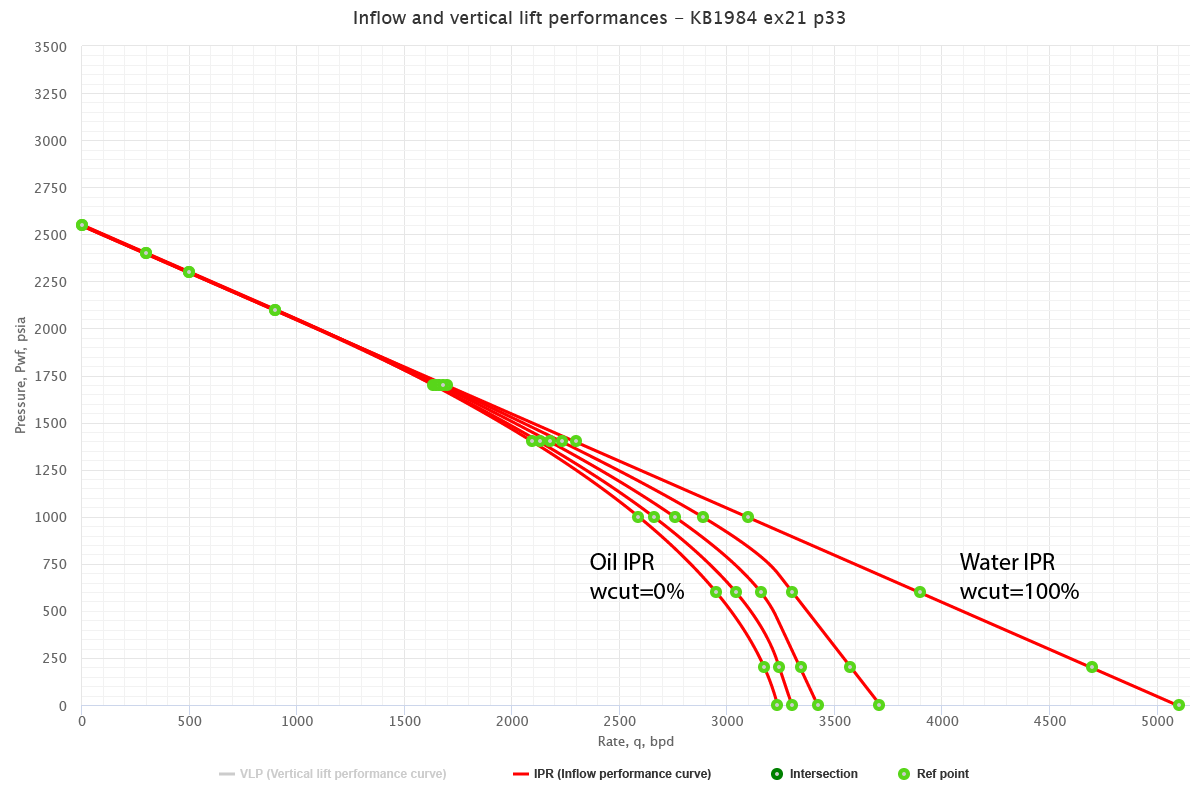
| 11:33, 15 April 2019 | 3 Phase IPR calculation example.png (file) |  |
67 KB | 3 Phase IPR calculation example | 1 |
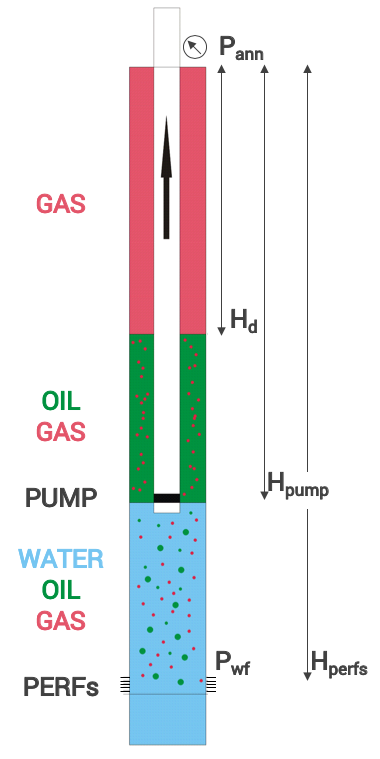
| 11:37, 27 April 2020 | BHP from the fluid level.png (file) |  |
58 KB | BHP from the fluid level notations | 1 |
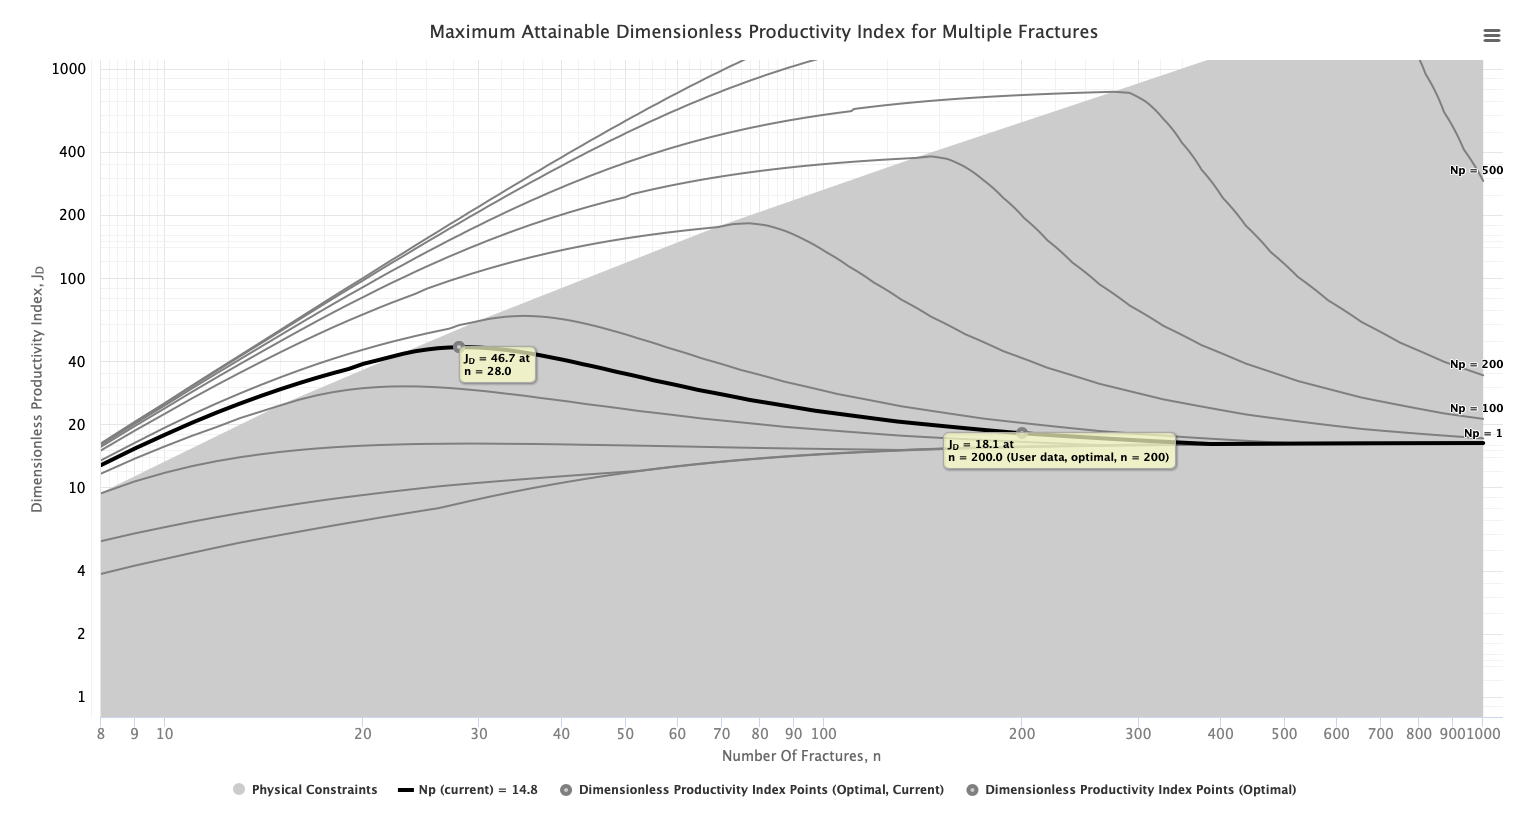
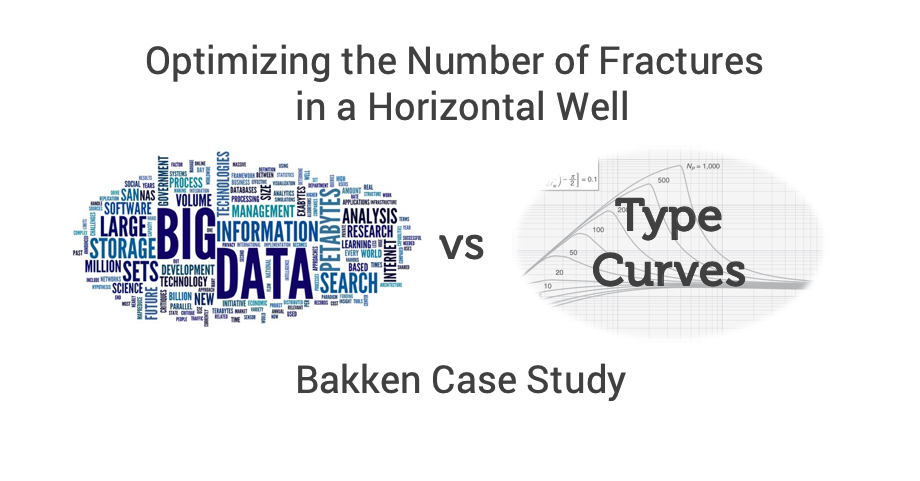
| 09:40, 21 November 2019 | Bakken Fracturing Optimization Case Study.png (file) |  |
126 KB | 1 | |
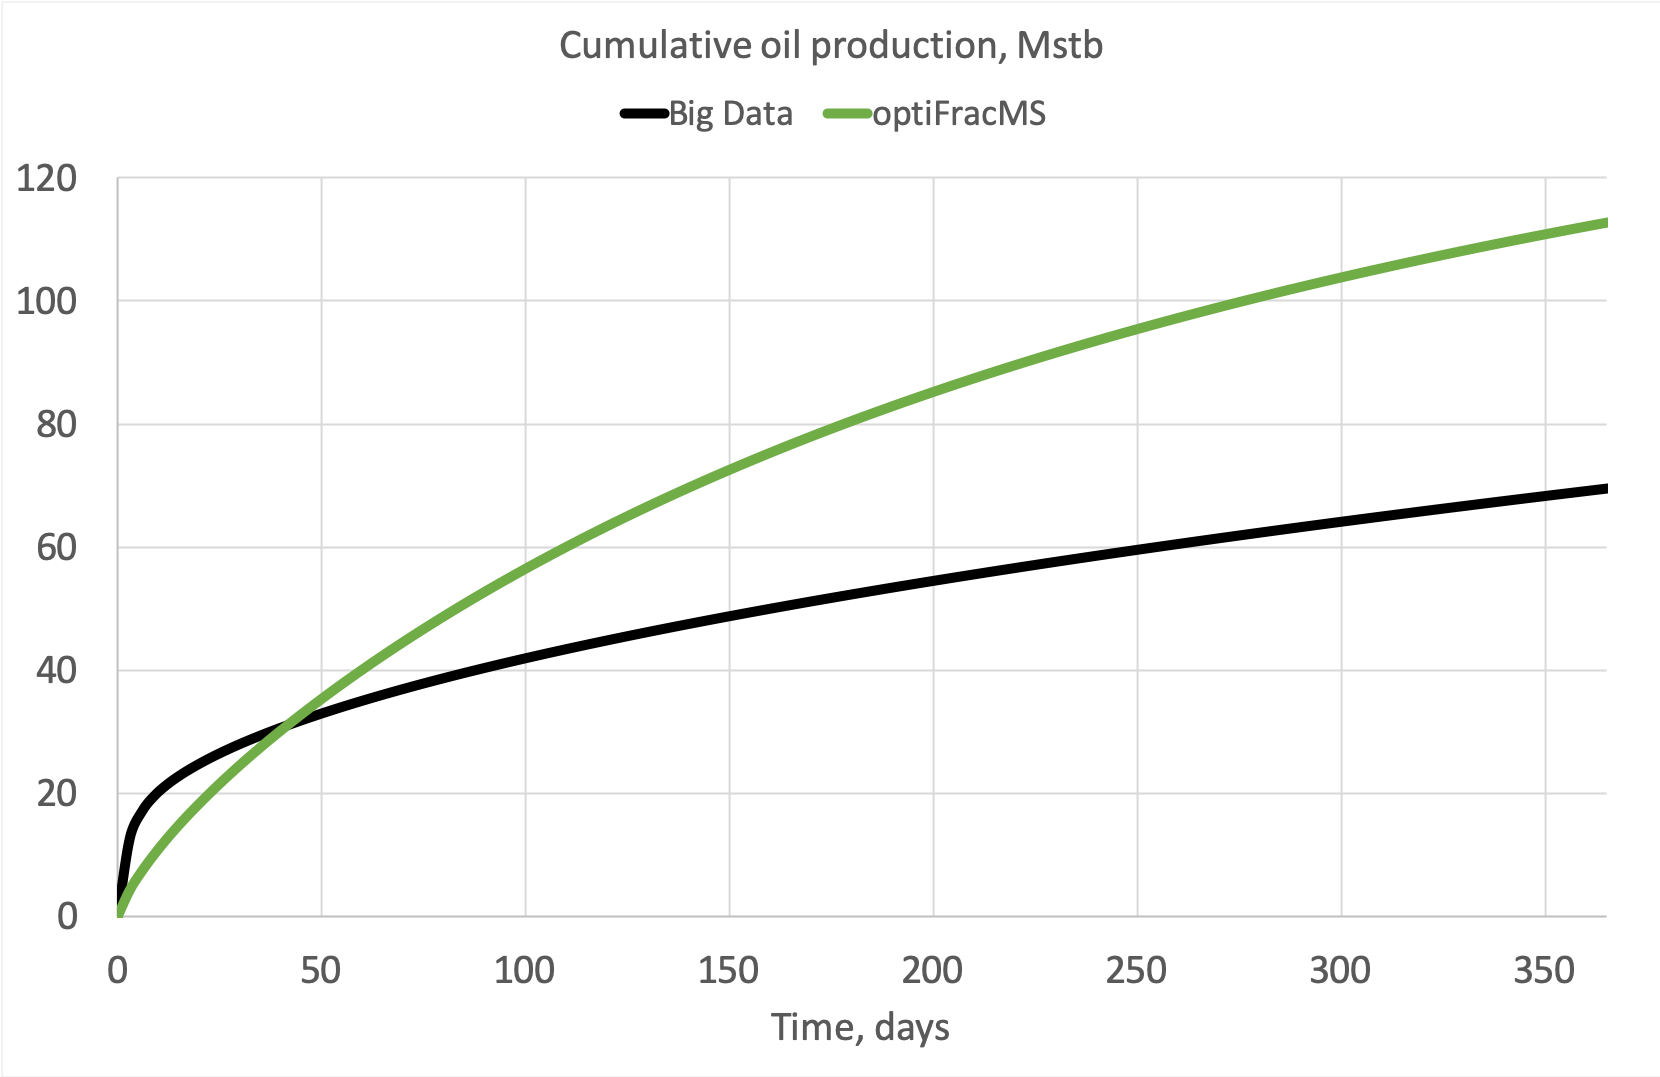
| 09:34, 21 November 2019 | Bakken cum oil rate fracturing forecast.png (file) |  |
107 KB | Bakken cumulative oil rate fracturing forecast | 1 |
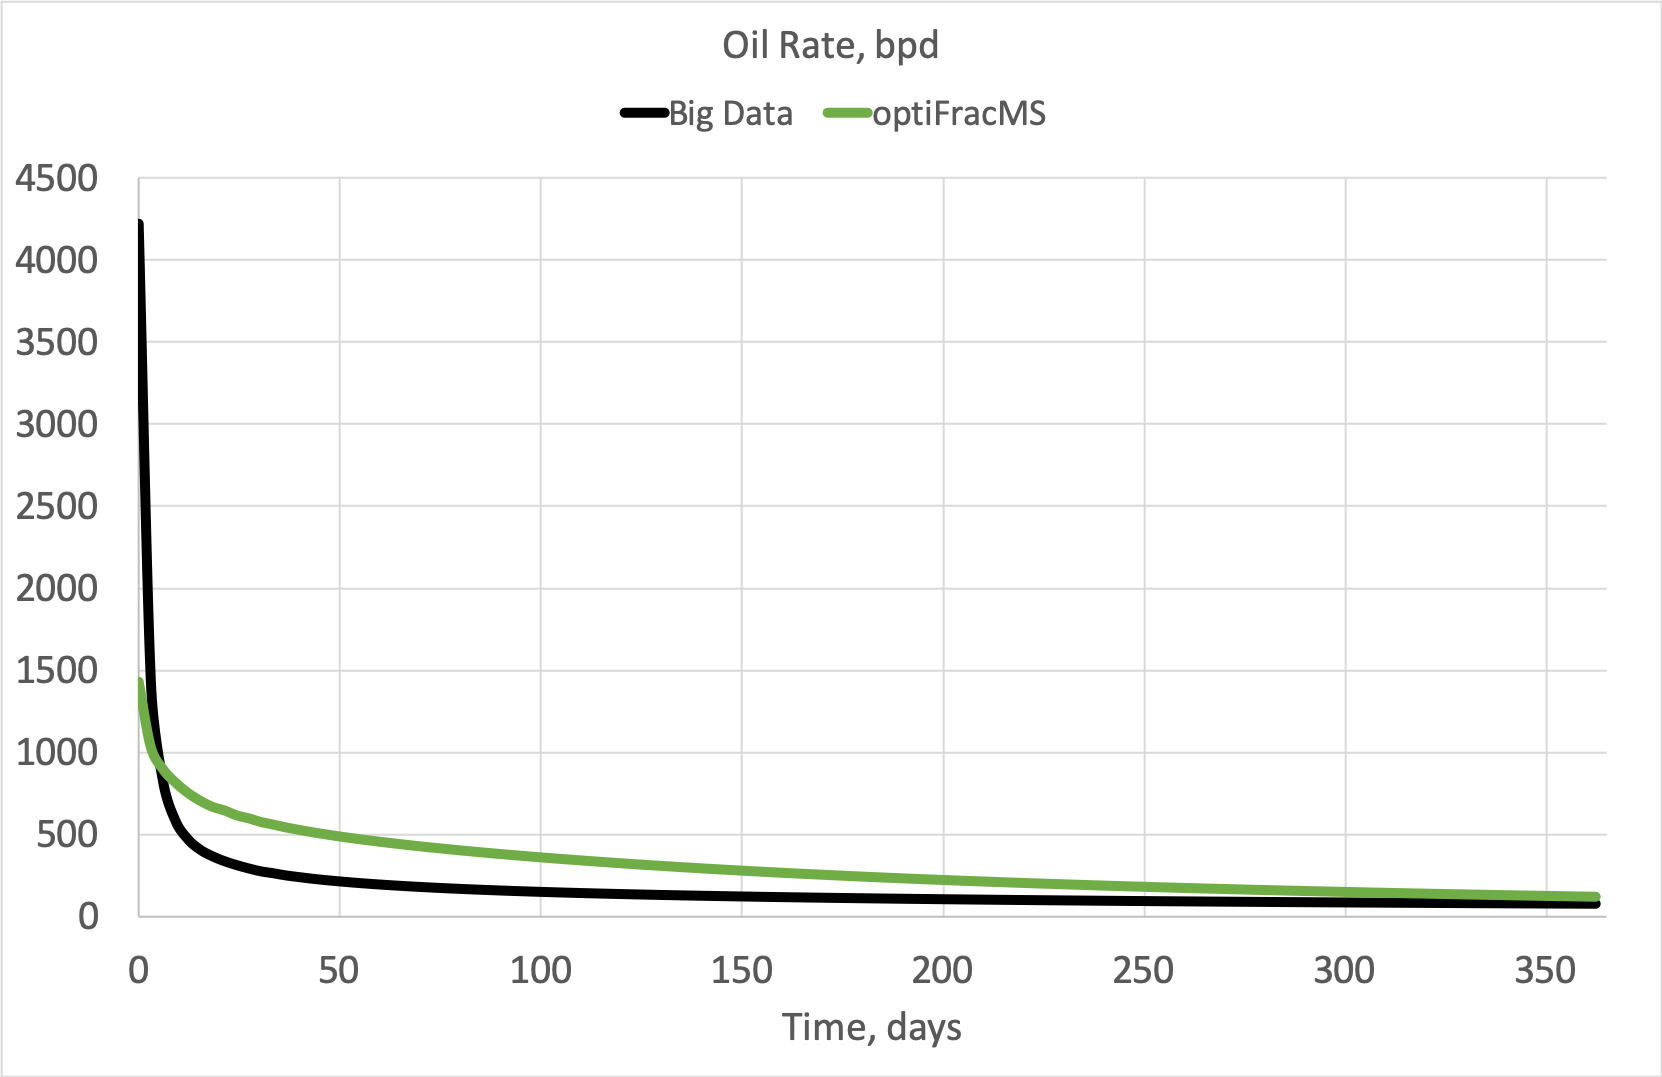
| 09:34, 21 November 2019 | Bakken oil rate fracturing forecast.png (file) |  |
97 KB | Bakken oil rate fracturing forecast | 1 |
| 12:56, 1 June 2017 | Beggs and Brill.png (file) |  |
44 KB | Comparison sPipe vs Beggs and Brill for Water | 1 |
| 11:57, 28 September 2020 | Beggs and Robinson.png (file) |  |
15 KB | Beggs and Robinson Oil Viscosity Correlation | 2 |
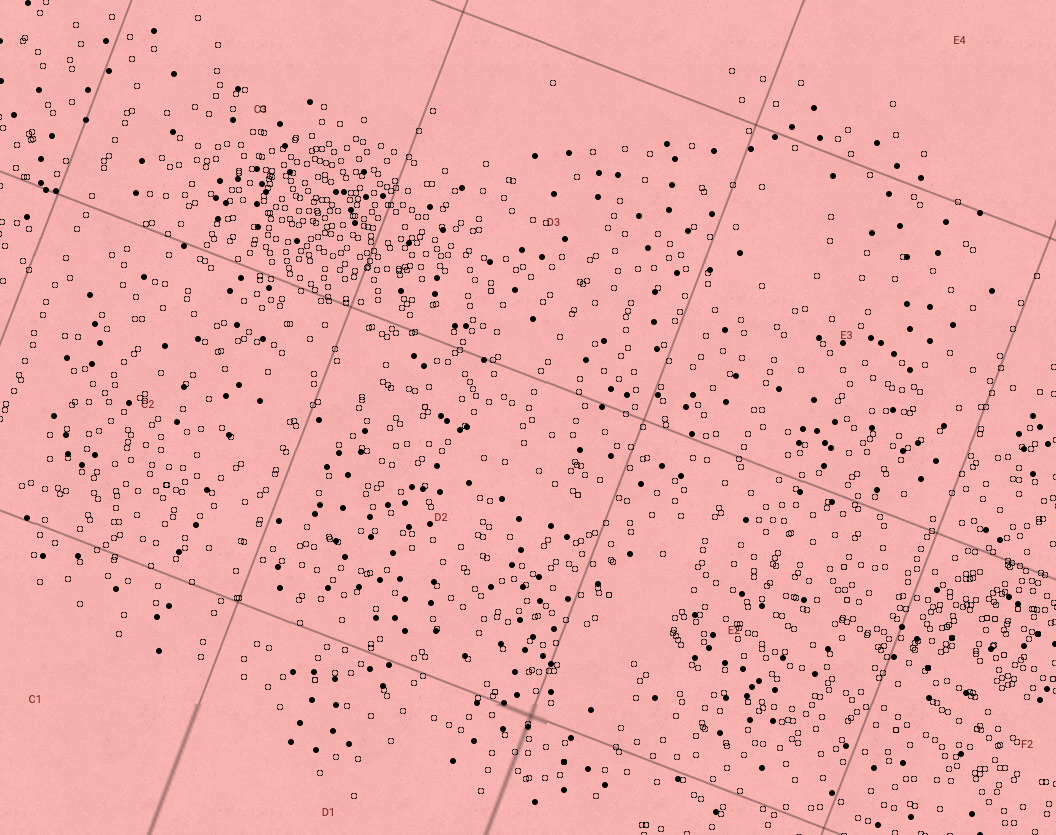
| 05:26, 22 November 2019 | Big Data vs Type Curves Bakken Case Study.png (file) |  |
170 KB | Big Data vs Type Curves Bakken Case Study | 1 |
| 15:43, 23 March 2022 | Block in waterflooding.png (file) |  |
367 KB | Example of dividing the field into the blocks in mature waterflood analysis | 1 |
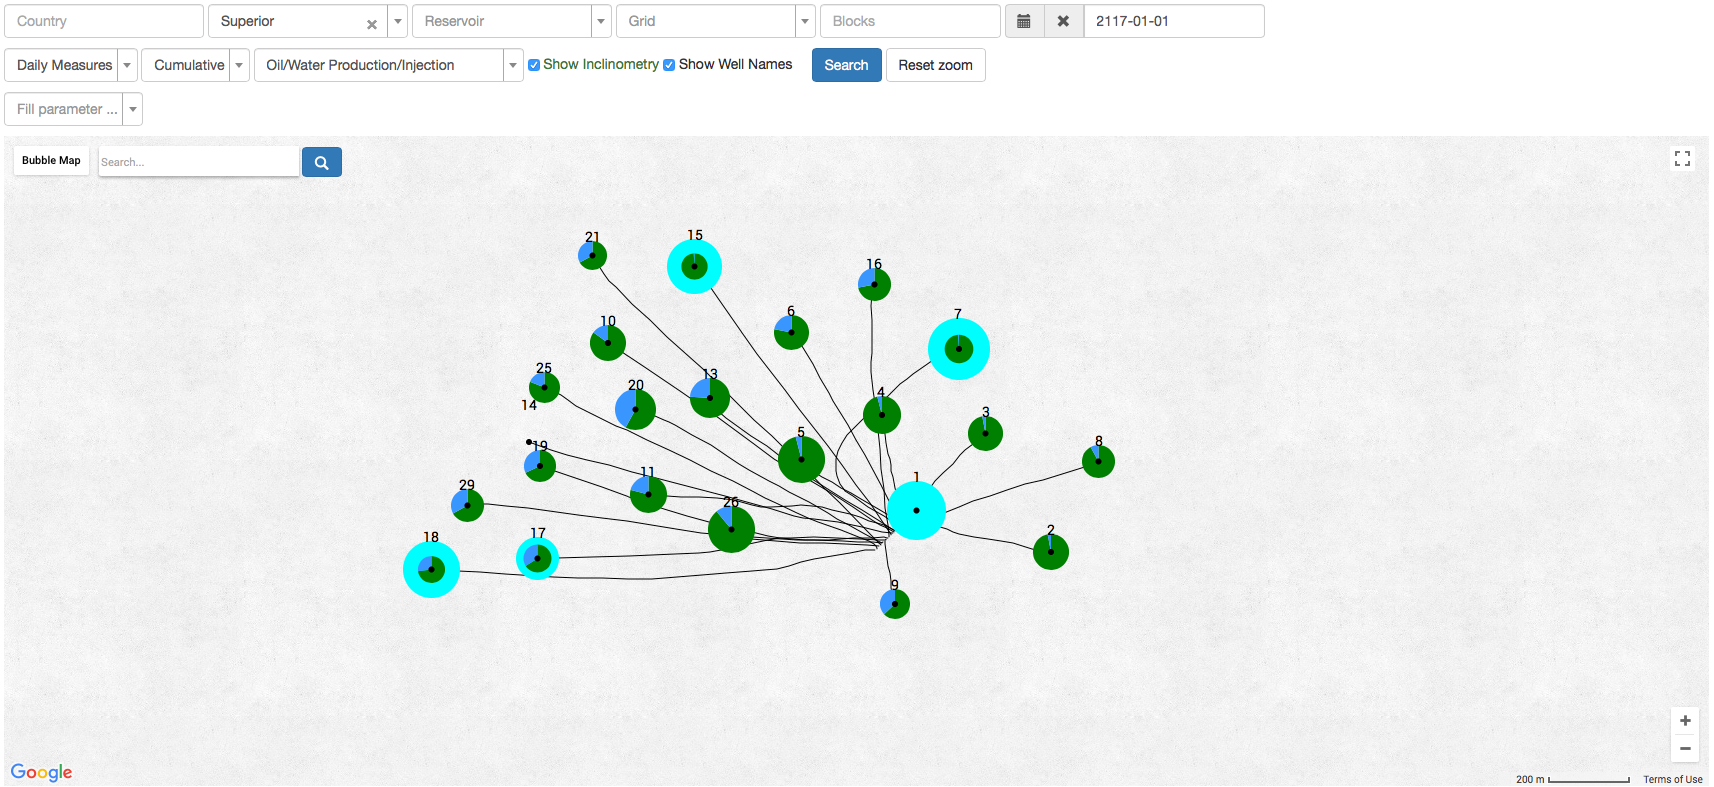
| 12:25, 27 December 2017 | BubbleMap.png (file) |  |
273 KB | Bubble map example | 1 |
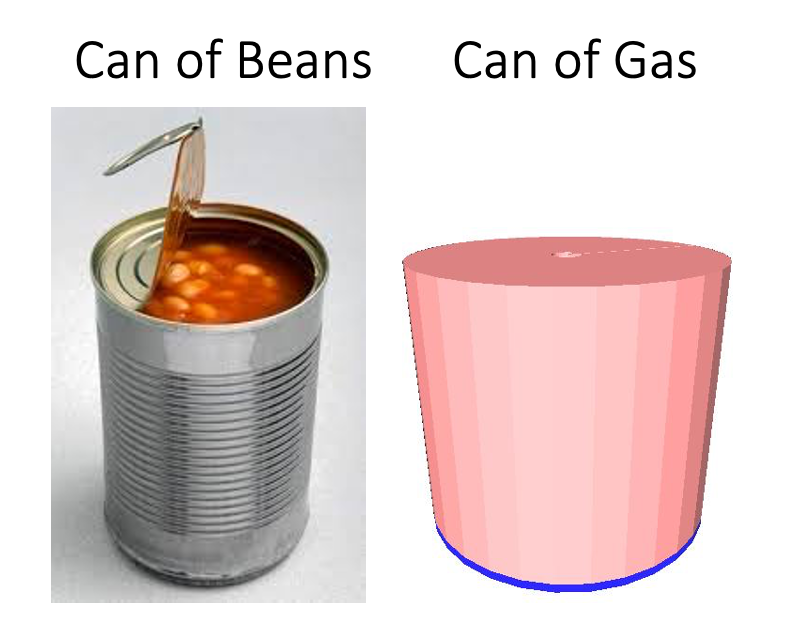
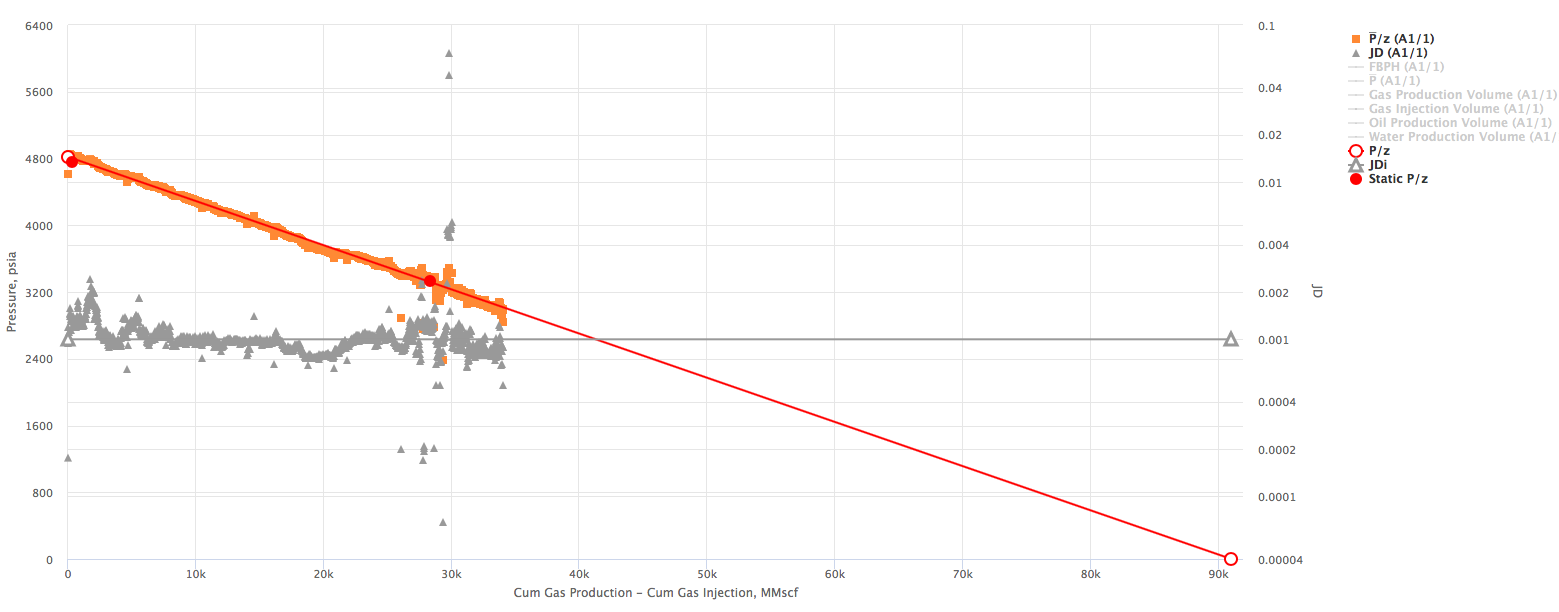
| 07:07, 12 December 2022 | Can Of Beans (Gas).png (file) | .png) |
289 KB | Can Of Beans (Gas) | 1 |
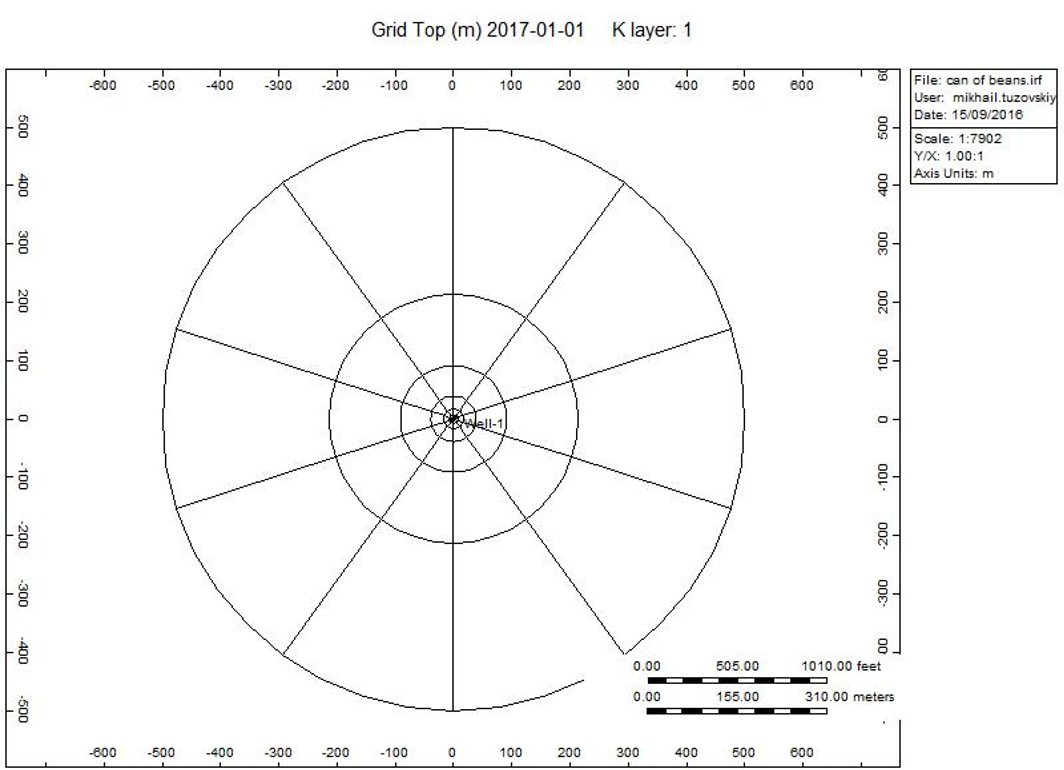
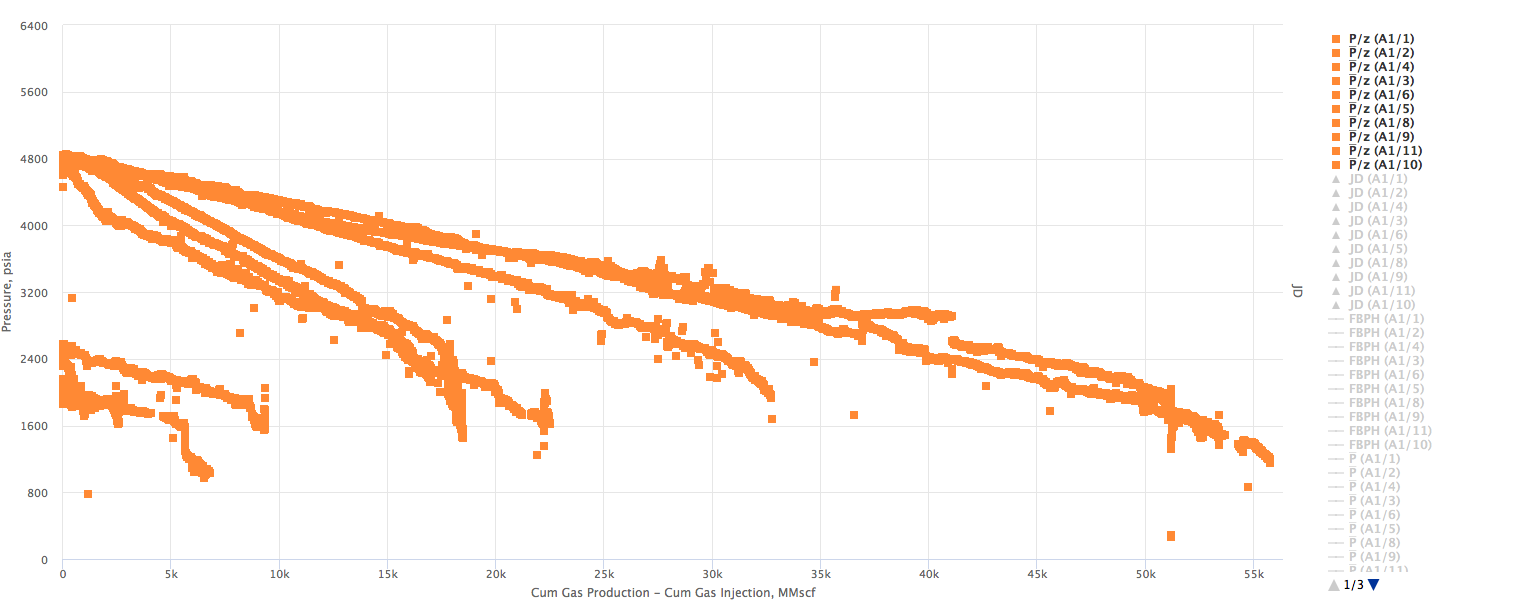
| 09:00, 12 December 2022 | Can of Beans (Gas) model.png (file) | _model.png) |
333 KB | Can_of_Beans_(Gas)_model | 1 |
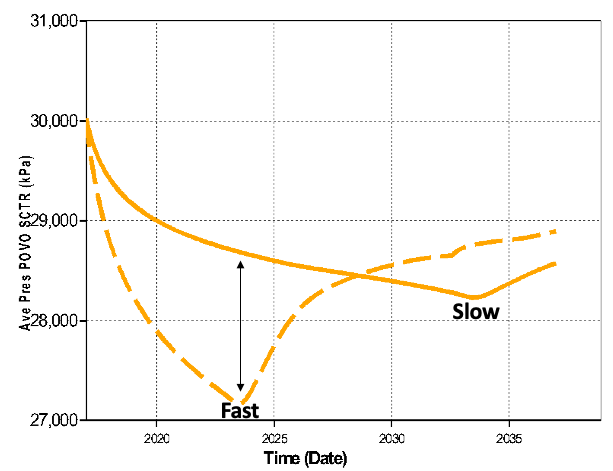
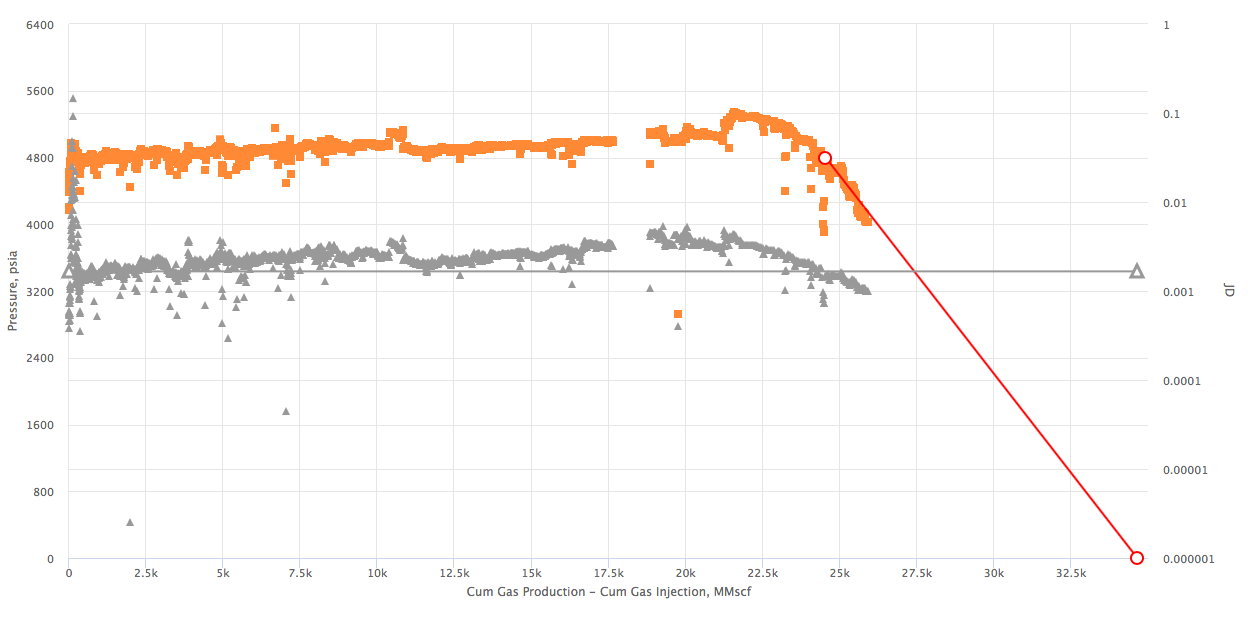
| 07:50, 12 December 2022 | Can of Beans (Gas) pressure.png (file) | _pressure.png) |
20 KB | Can_of_Beans_(Gas)_pressure | 1 |
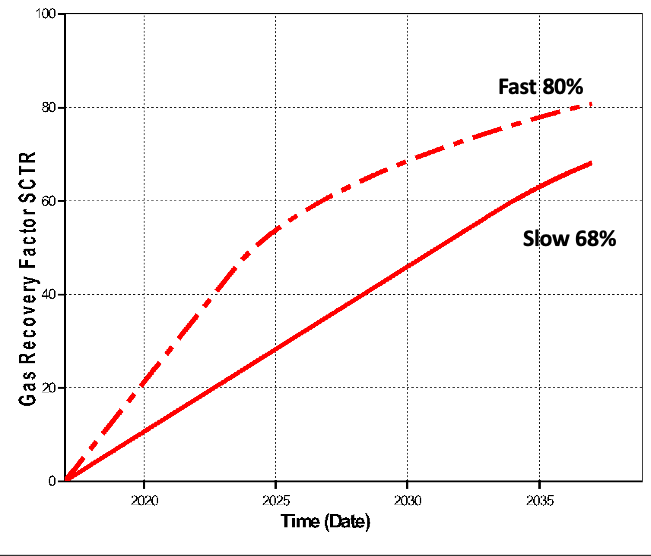
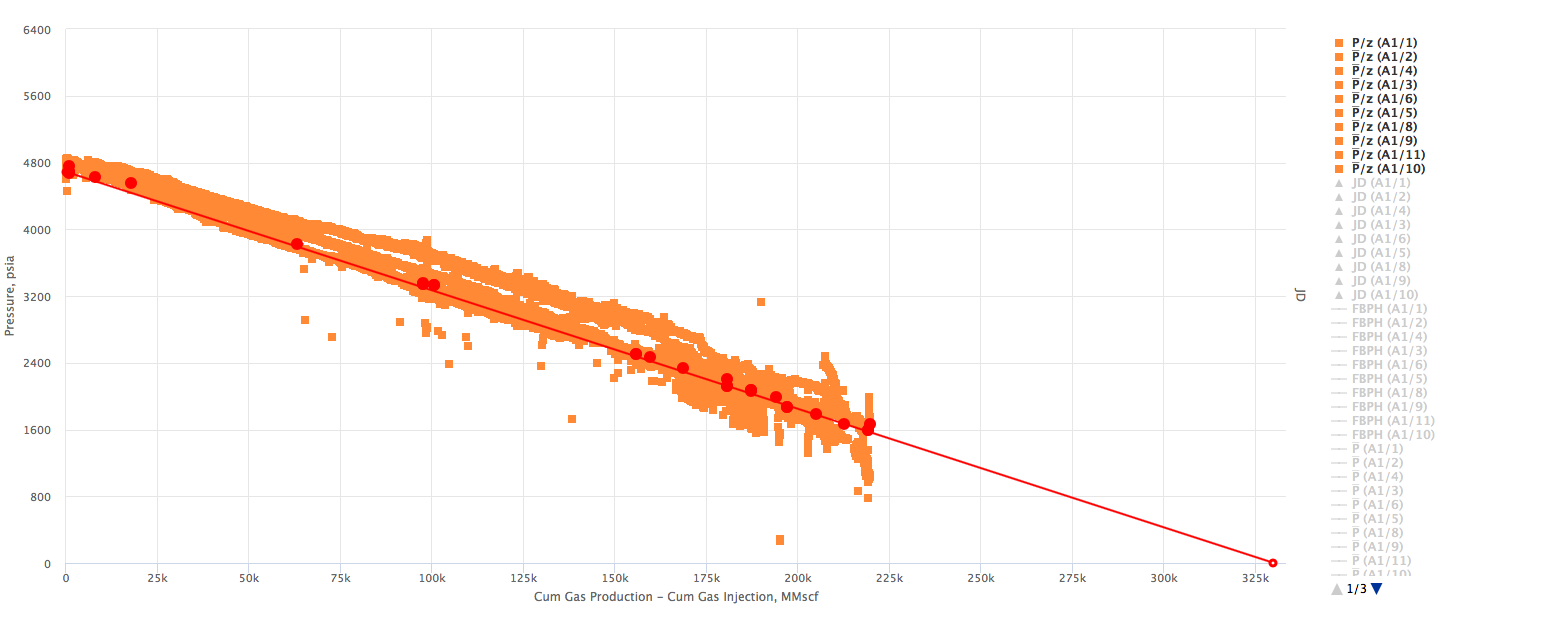
| 07:46, 12 December 2022 | Can of Beans (Gas) recovery.png (file) | _recovery.png) |
23 KB | Can_of_Beans_(Gas)_recovery | 1 |
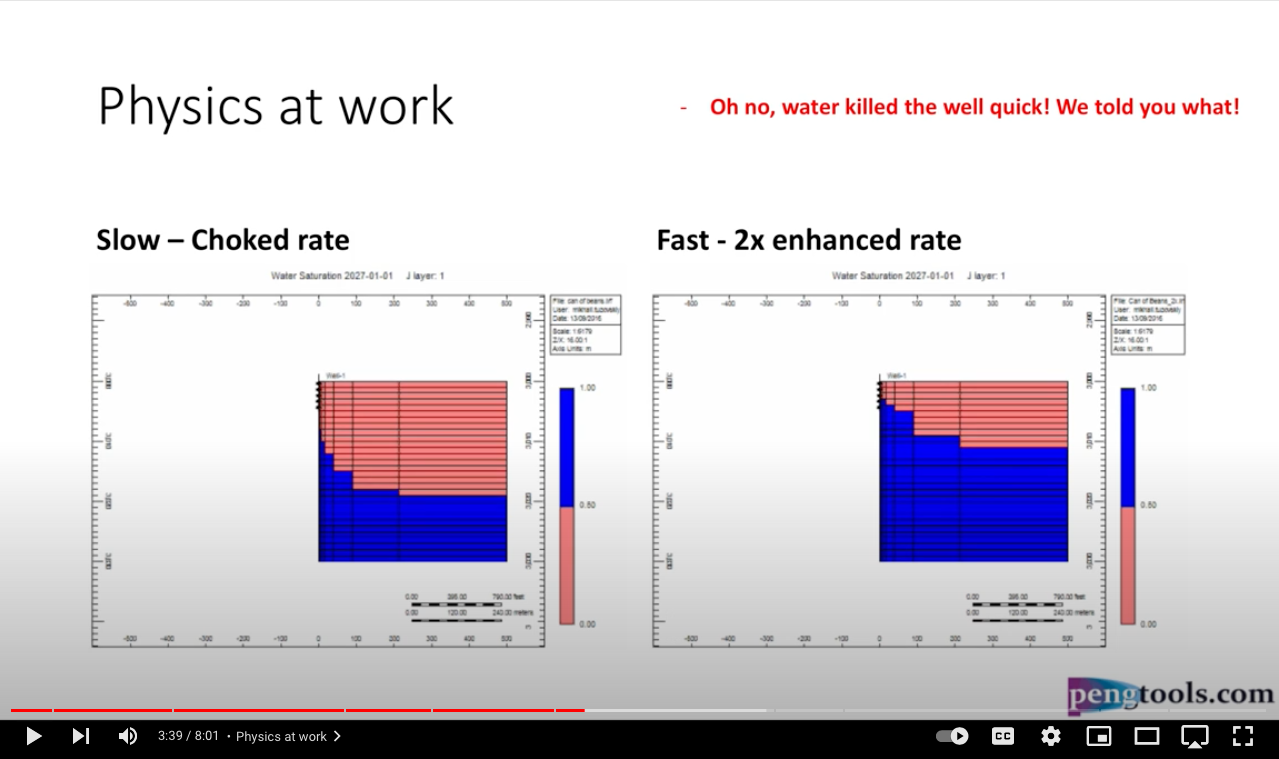
| 08:12, 12 December 2022 | Can of Beans (Gas) video.png (file) | _video.png) |
255 KB | Can_of_Beans_(Gas)_video | 1 |
| 07:38, 12 December 2022 | Can of beans Water Saturation fast.gif (file) |  |
1.7 MB | Can_of_beans_Water_Saturation_fast | 1 |
| 07:34, 12 December 2022 | Can of beans Water Saturation slow.gif (file) |  |
2.1 MB | Can_of_beans_Water_Saturation_slow | 1 |
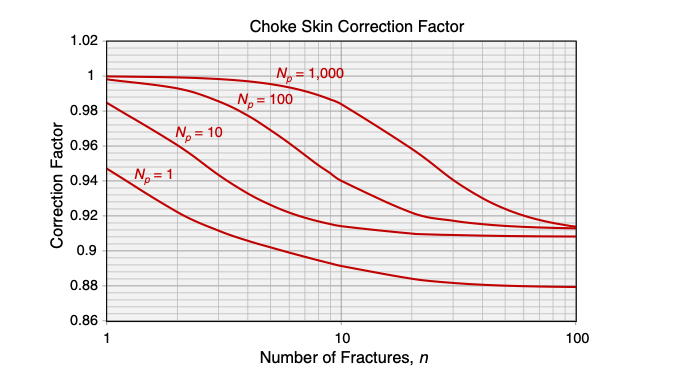
| 09:40, 11 November 2019 | Choke skin correction factor.png (file) |  |
43 KB | Choke skin correction factor | 1 |
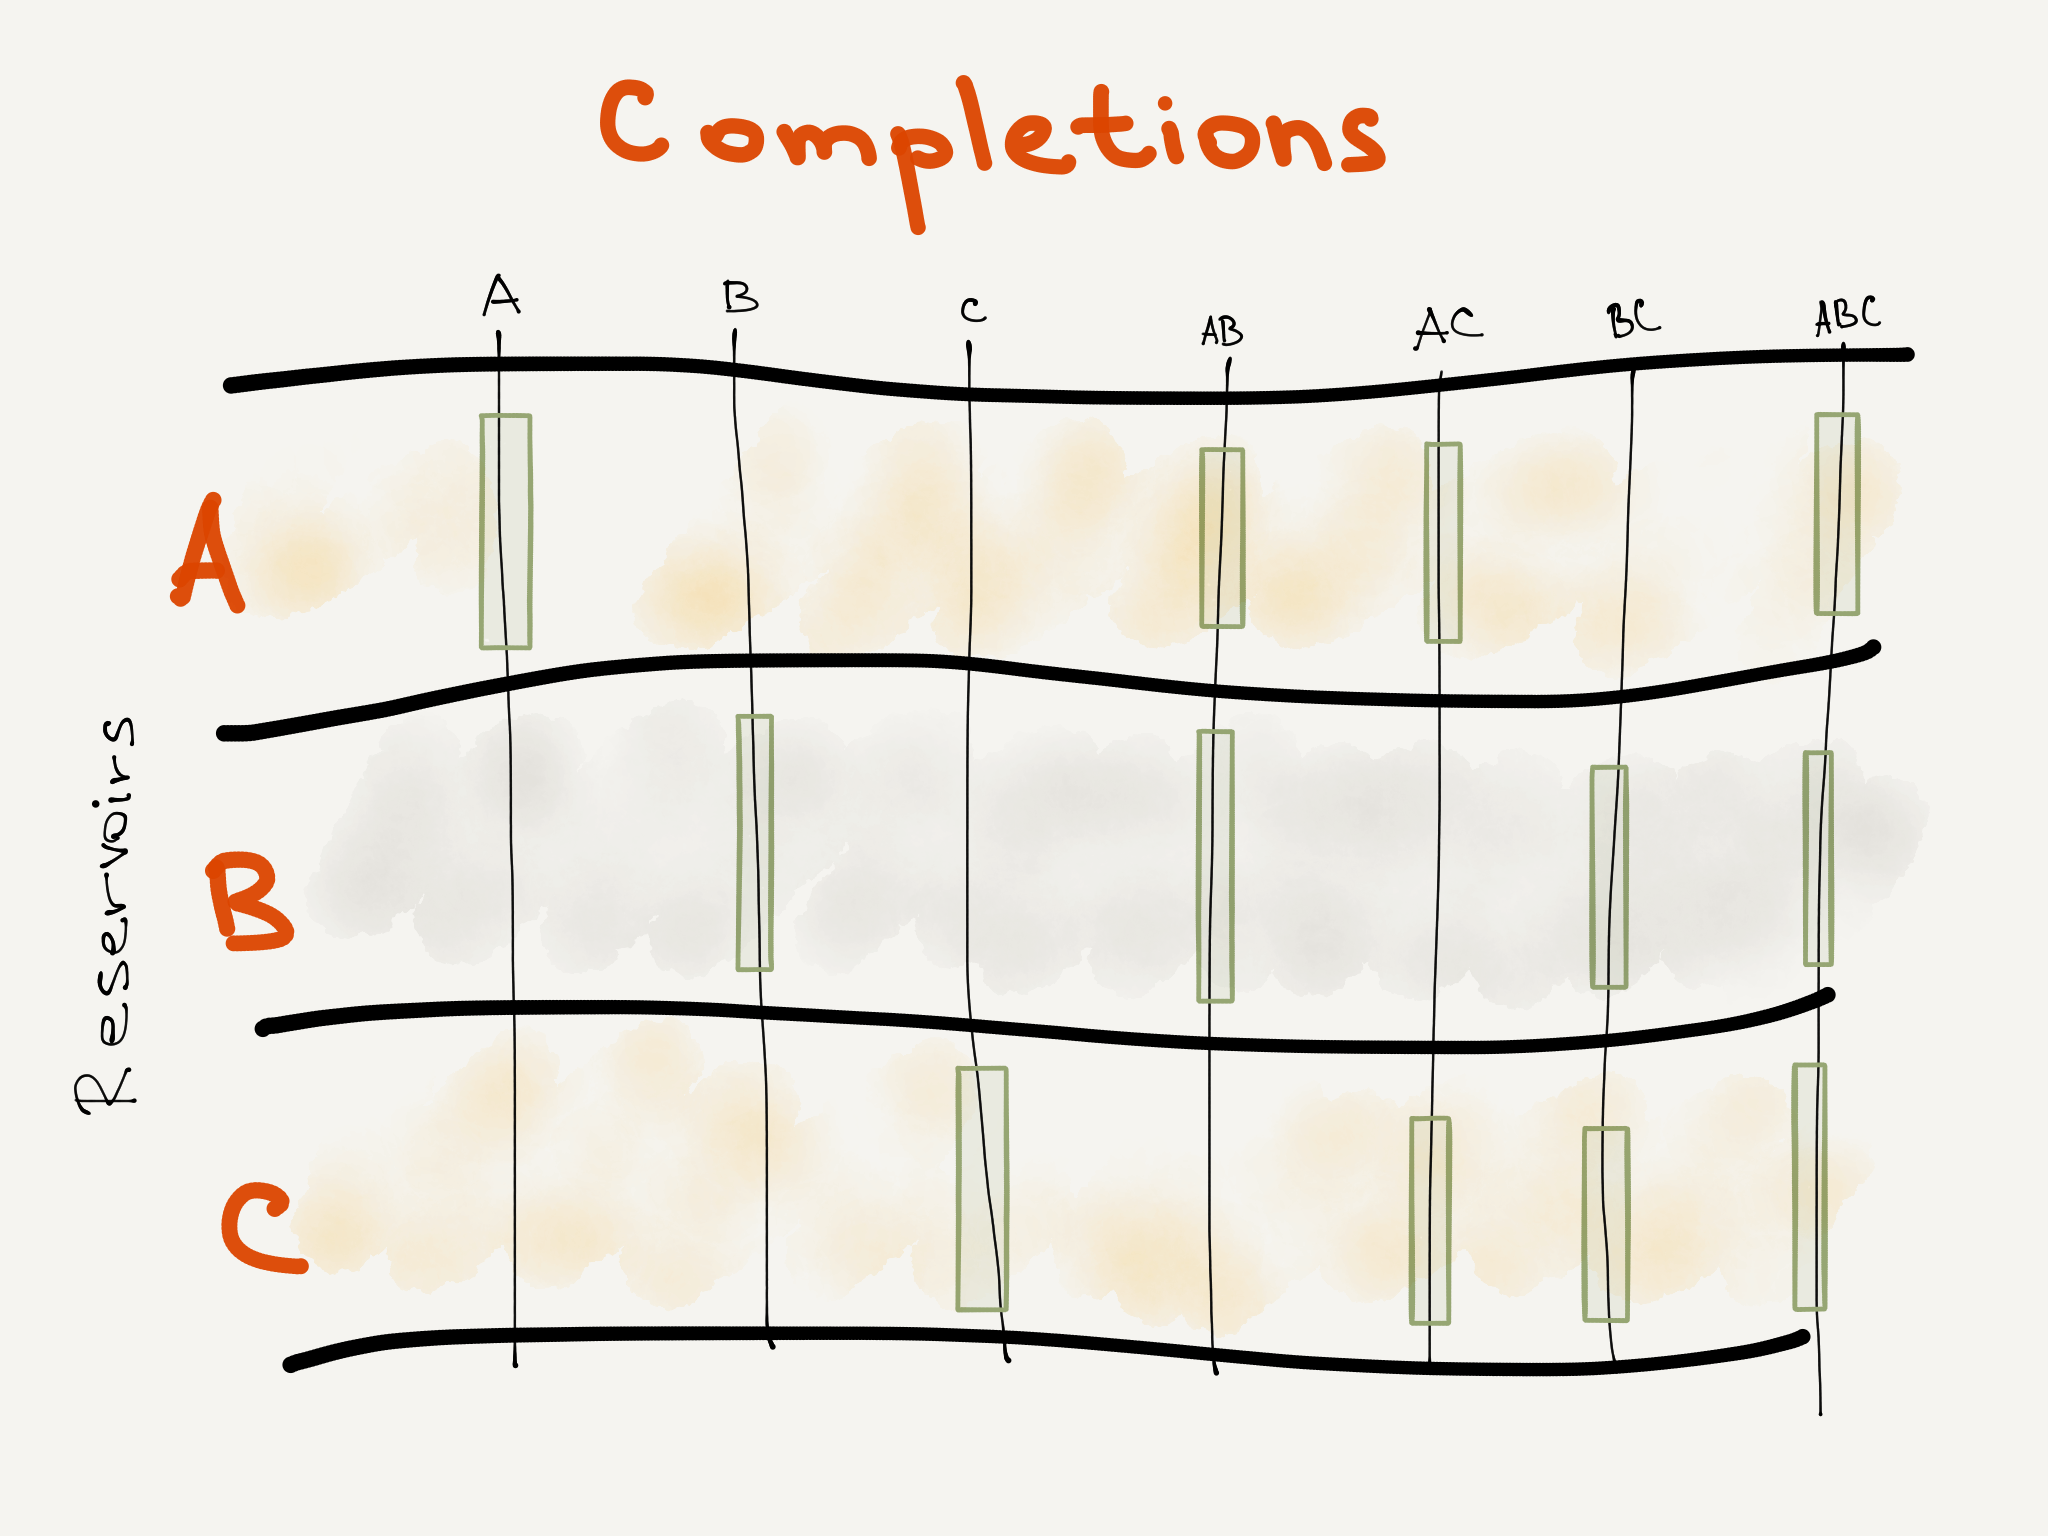
| 16:15, 6 March 2017 | Completion.png (file) |  |
940 KB | Completion examples | 2 |
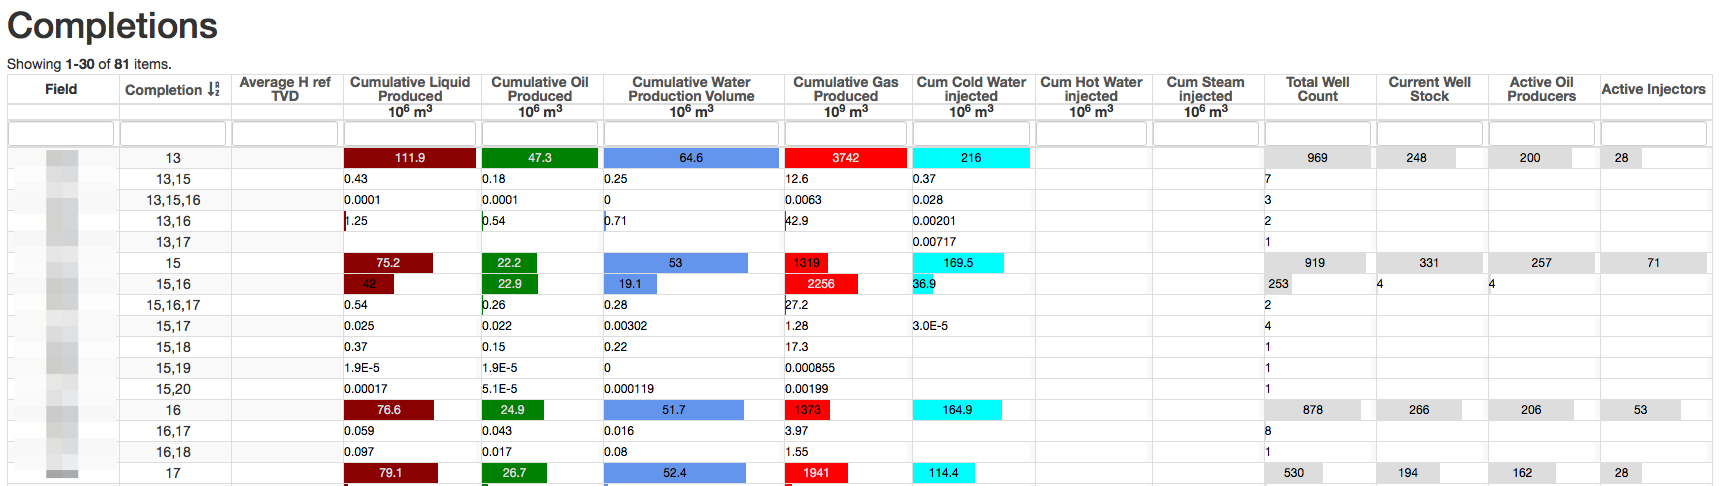
| 15:55, 6 March 2017 | Completion check.png (file) |  |
77 KB | 1 | |
| 06:36, 17 April 2019 | Composite IPR Curve.png (file) |  |
120 KB | Composite IPR Curve | 1 |
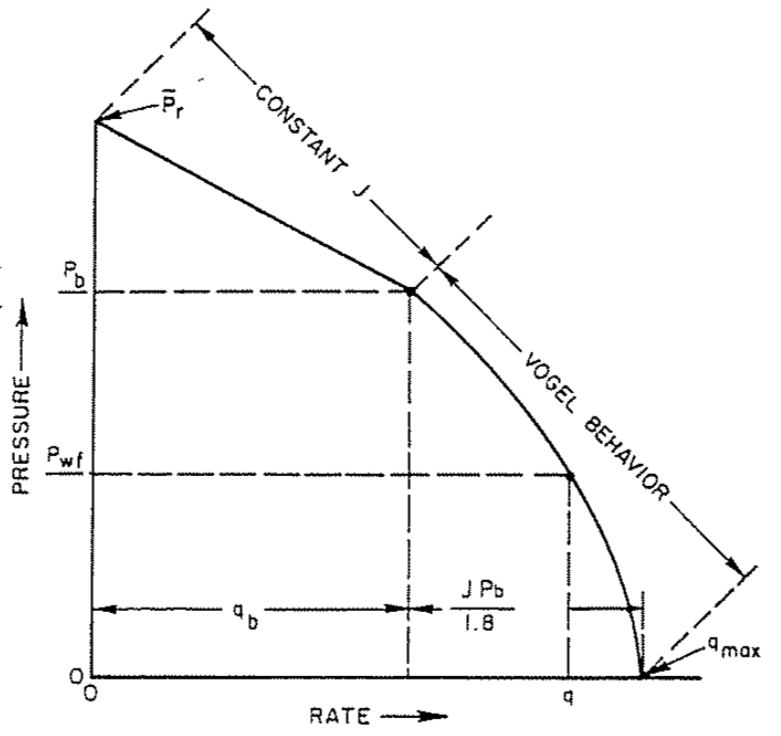
| 08:33, 5 April 2019 | Constant PI and Vogel's IPR.png (file) |  |
81 KB | Constant PI and Vogel's IPR | 1 |
| 09:12, 6 December 2017 | DCA.gif (file) |  |
174 KB | Decline Curve Analysis | 1 |
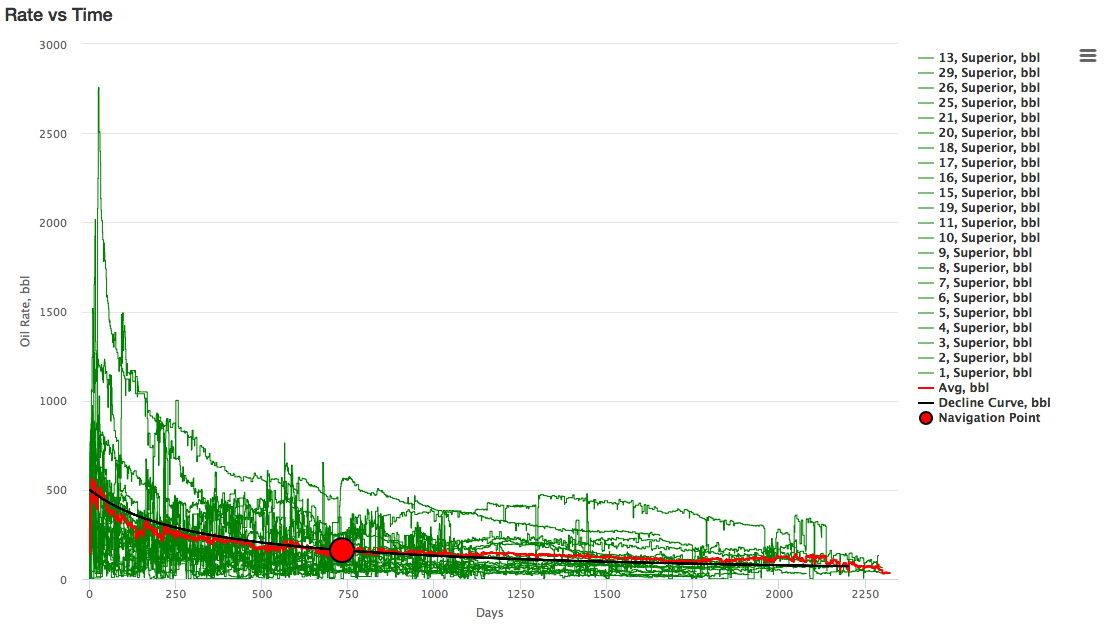
| 09:21, 6 December 2017 | DCA for multiple wells.png (file) |  |
96 KB | Decline Curve Analysis applied to multiple wells | 1 |
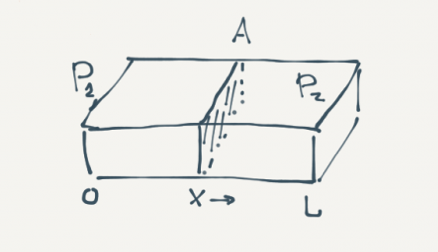
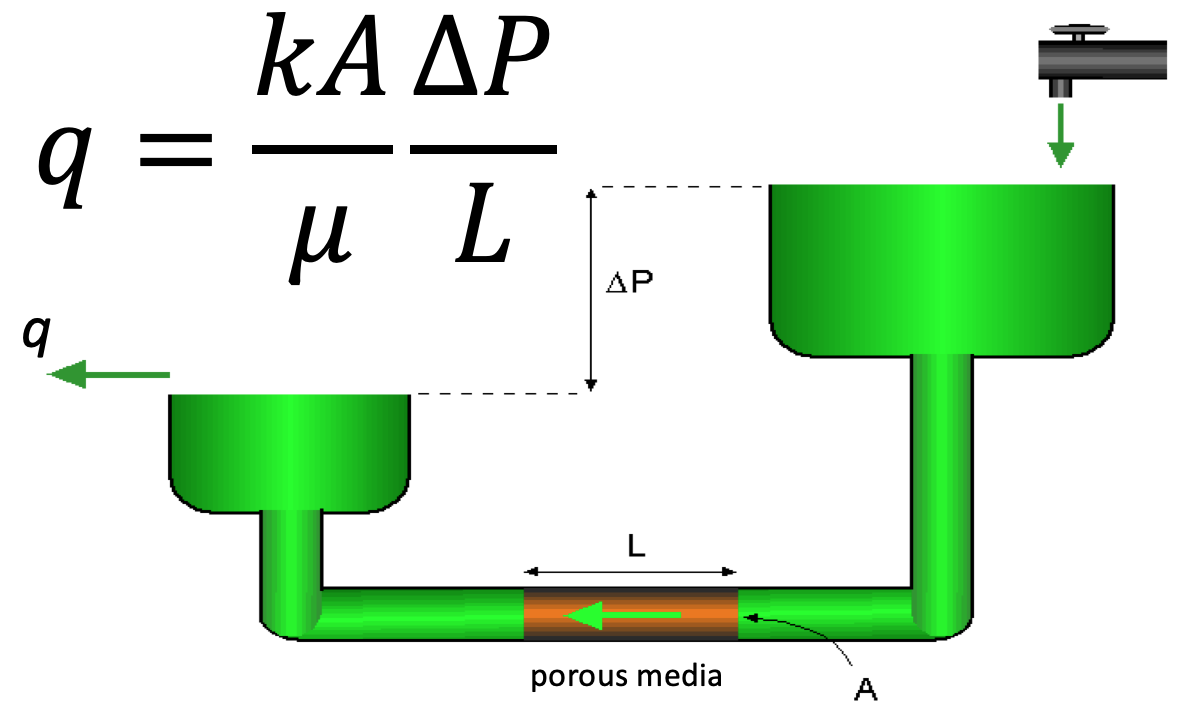
| 15:11, 22 July 2019 | Darcy's Law Linear form equation.png (file) |  |
48 KB | Darcy's Law Linear form equation | 1 |
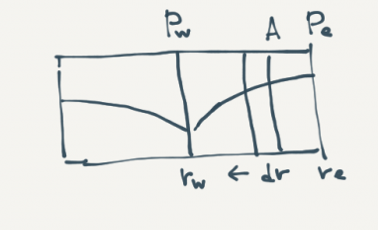
| 15:11, 22 July 2019 | Darcy's Law Radial form equation.png (file) |  |
42 KB | Darcy's Law Radial form equation | 1 |
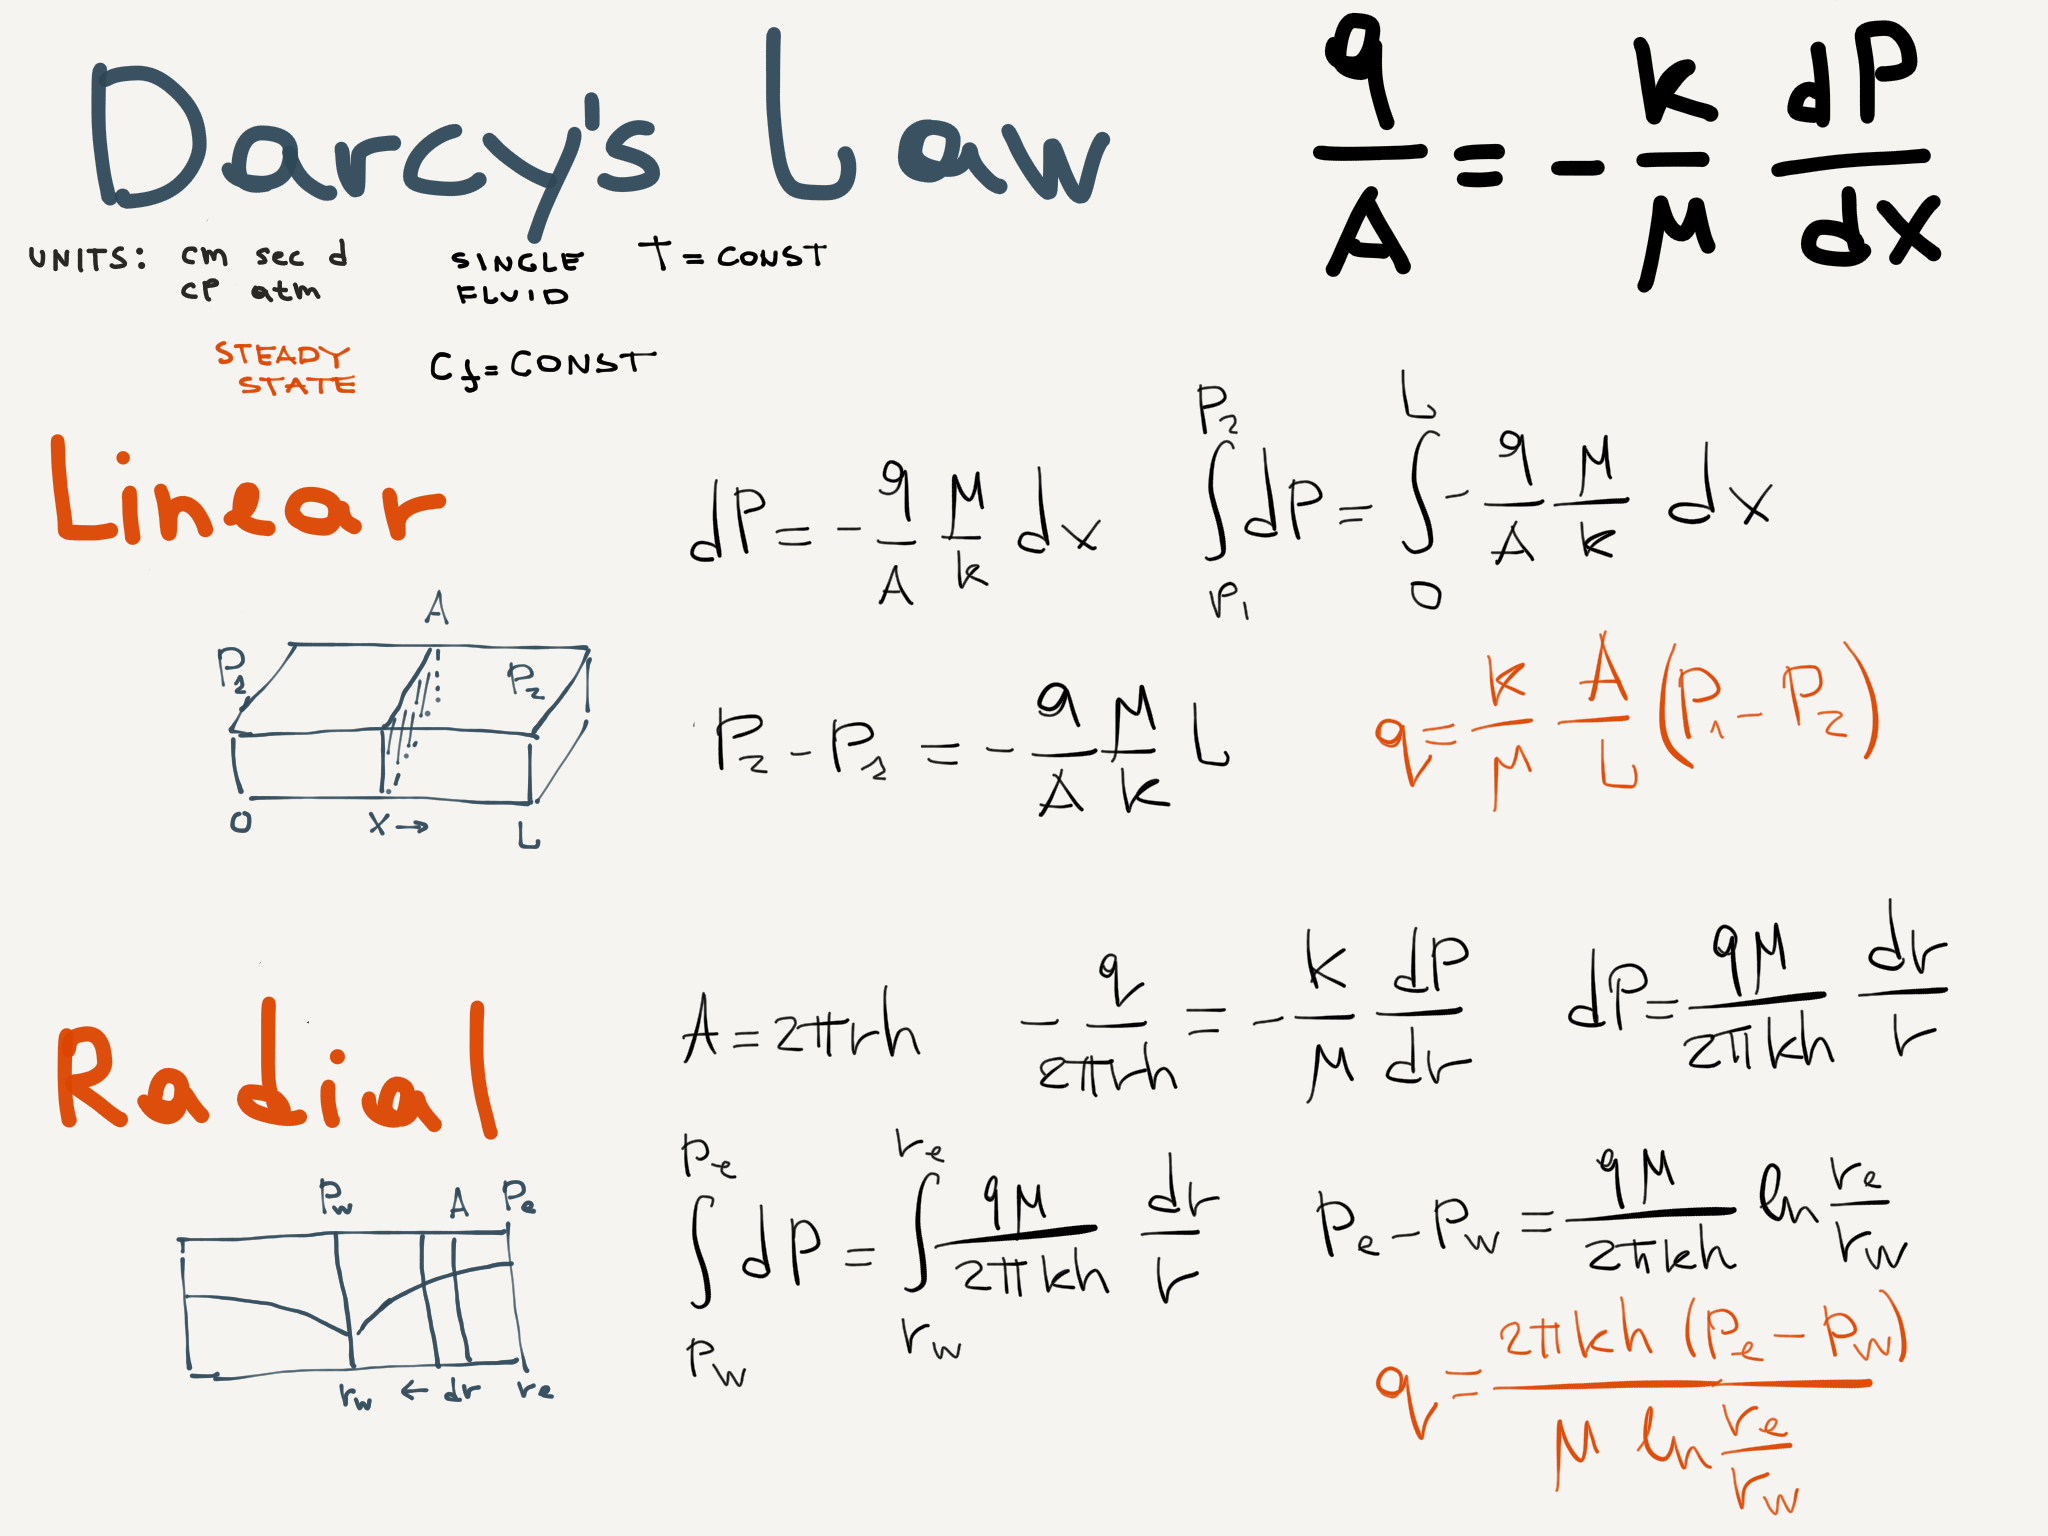
| 12:57, 23 April 2018 | Darcy's Law mtuz.png (file) |  |
420 KB | Darcy's Law Linear and Radial inflow equations | 1 |
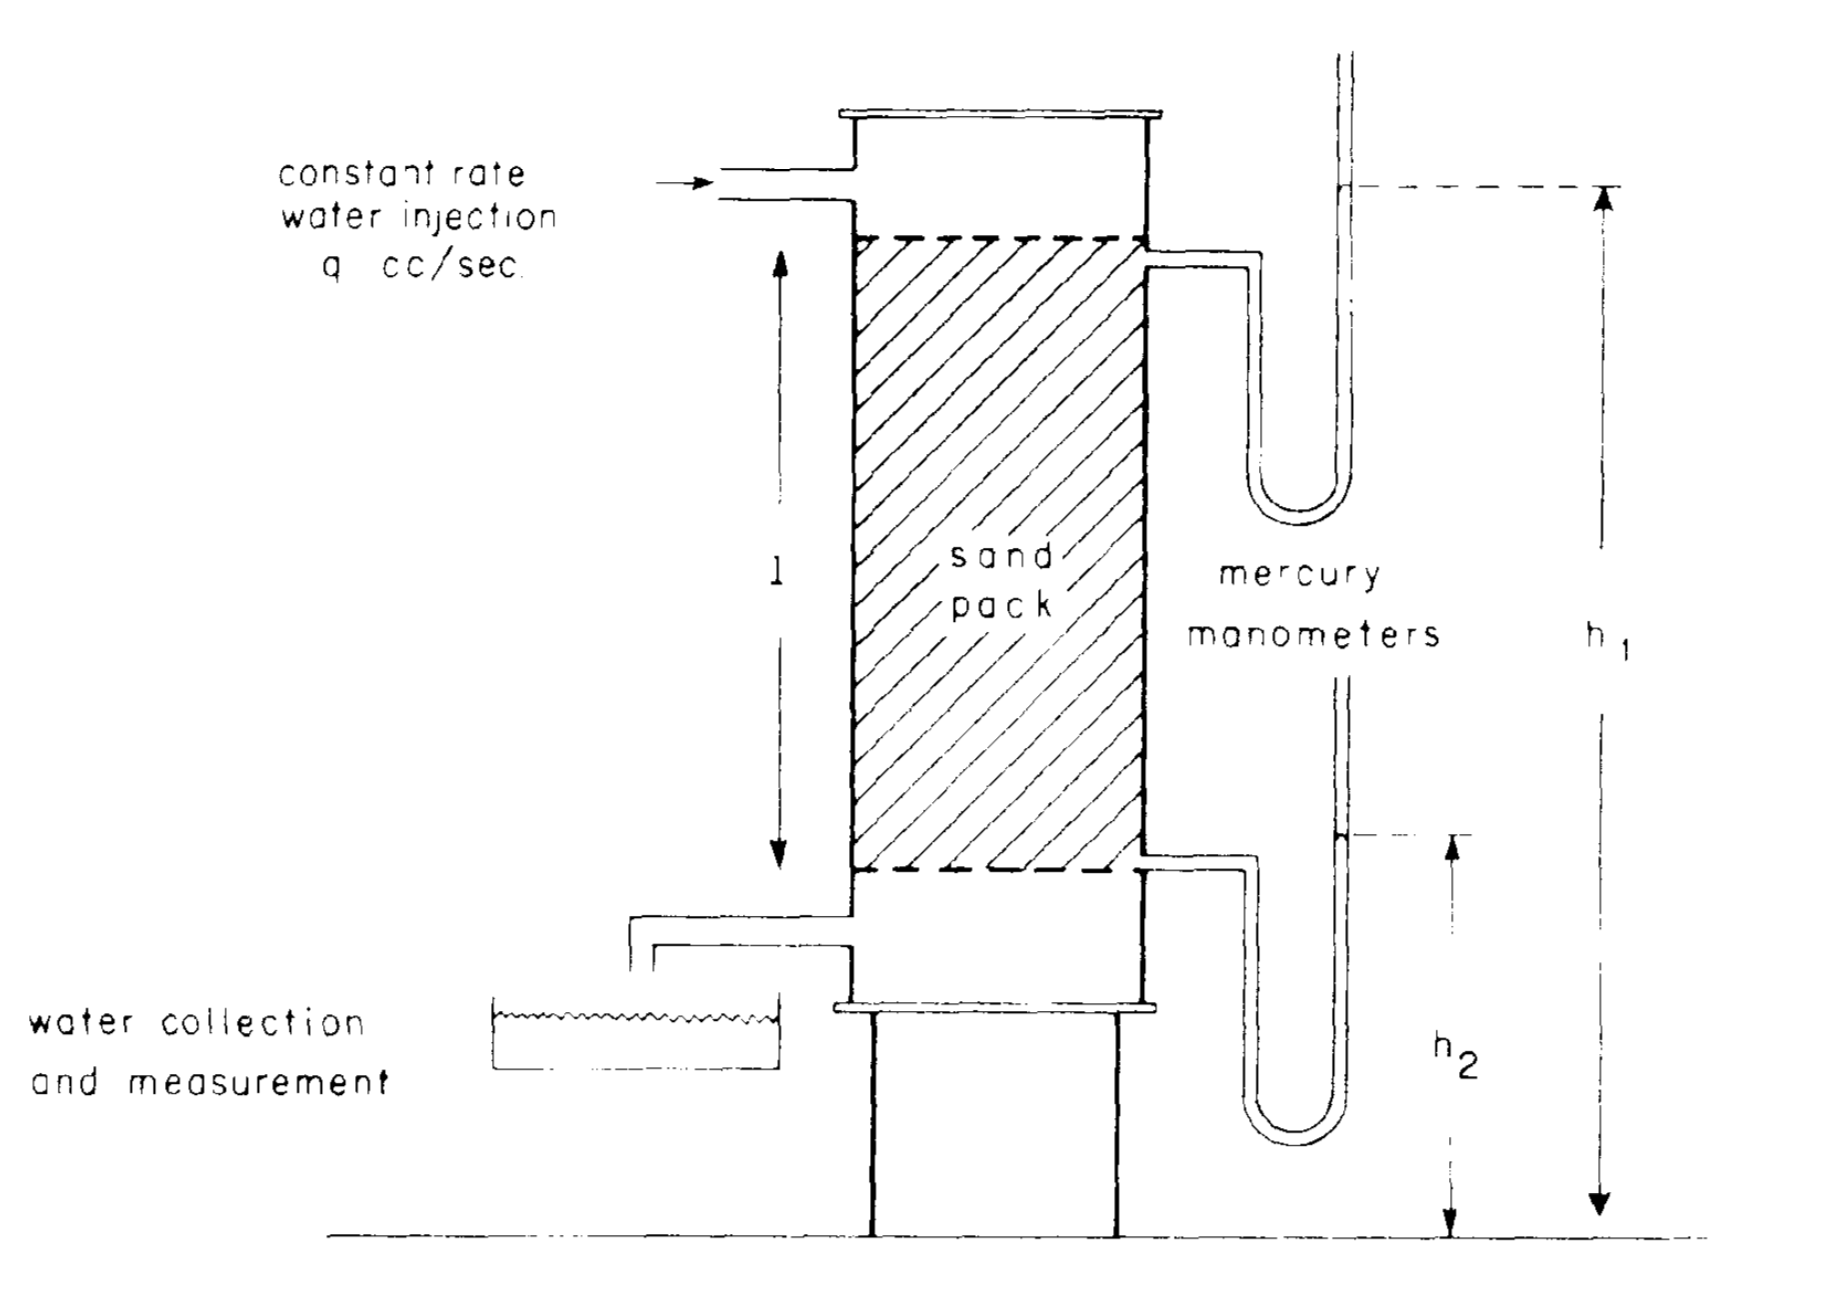
| 13:54, 22 July 2019 | Darcy's experimental equipment.png (file) |  |
213 KB | Darcy's experimental equipment | 1 |
| 13:29, 22 July 2019 | Darcy's law.png (file) |  |
39 KB | Darcy's law | 1 |
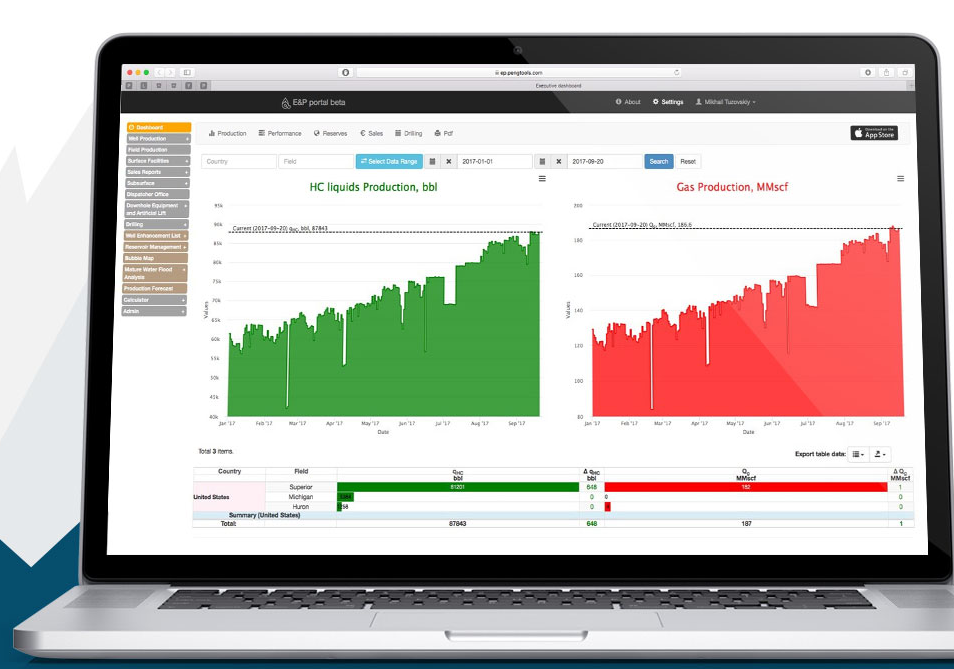
| 08:58, 6 December 2017 | EPPortal.png (file) |  |
284 KB | E&P Portal | 1 |
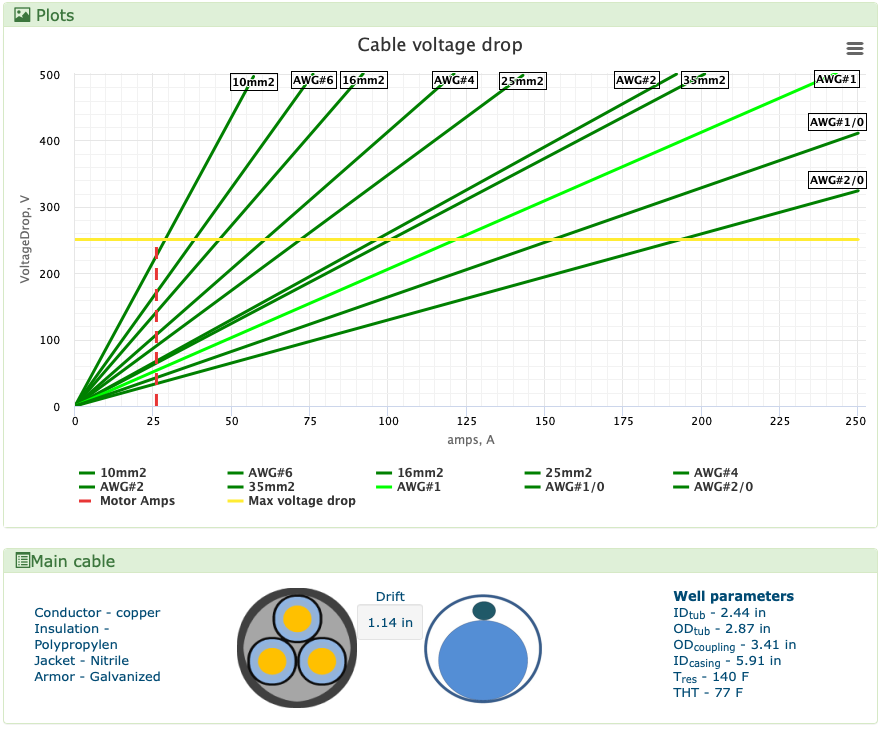
| 17:41, 6 December 2018 | ESP Cable.png (file) |  |
126 KB | AWG CPNR Centrilift 34.5/-/2.51kg/m SOL 5kV | 1 |
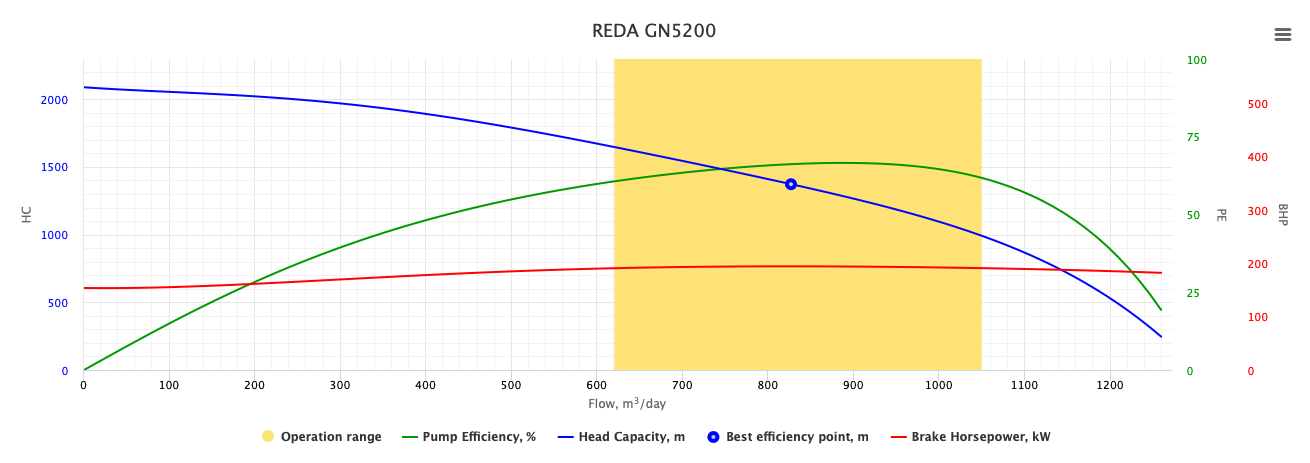
| 11:38, 6 December 2018 | ESP Diagram.png (file) |  |
53 KB | REDA GN5200 ESP Diagram | 2 |
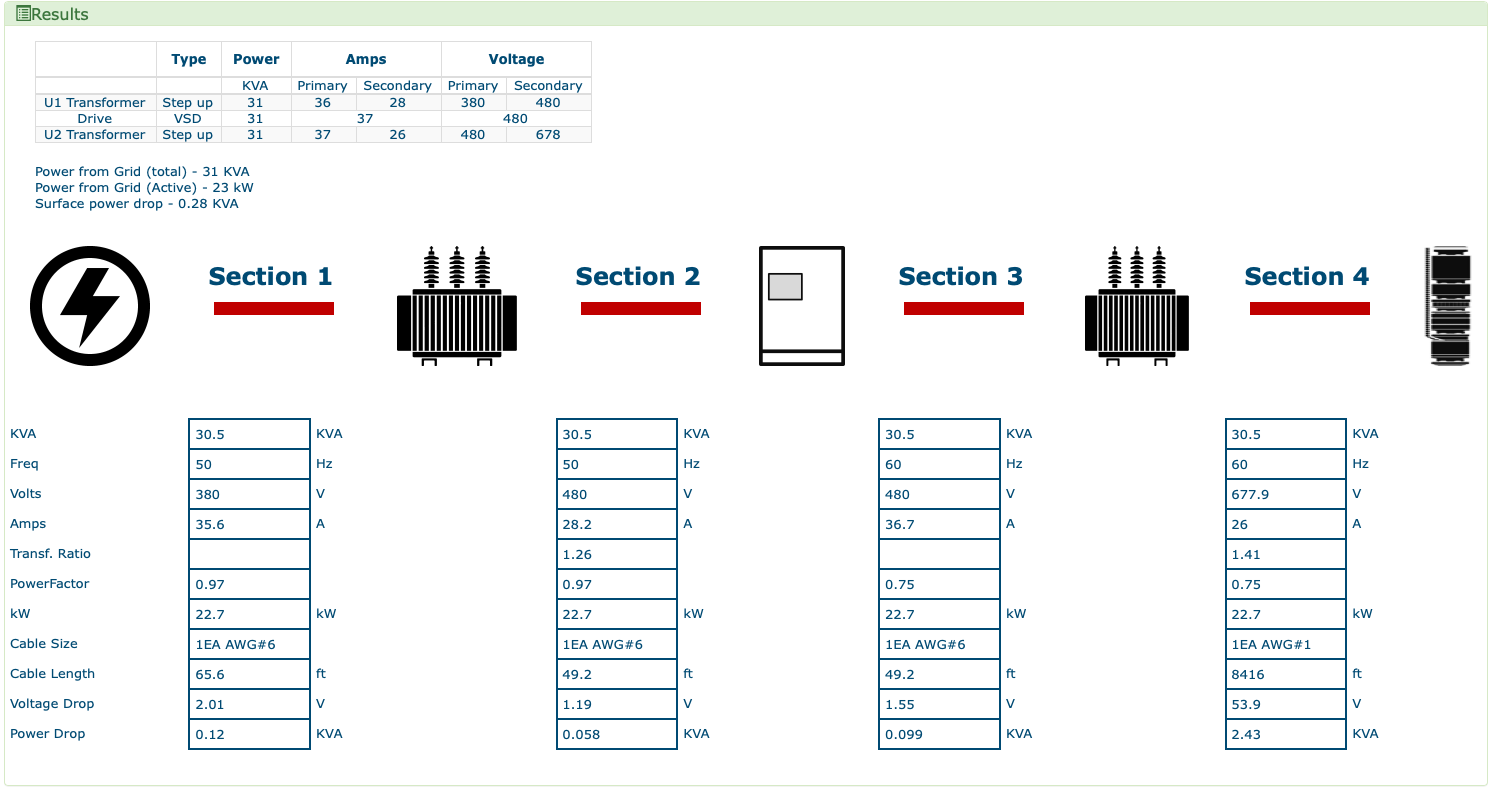
| 17:41, 6 December 2018 | ESP Drive.png (file) |  |
92 KB | ESP Drive | 1 |
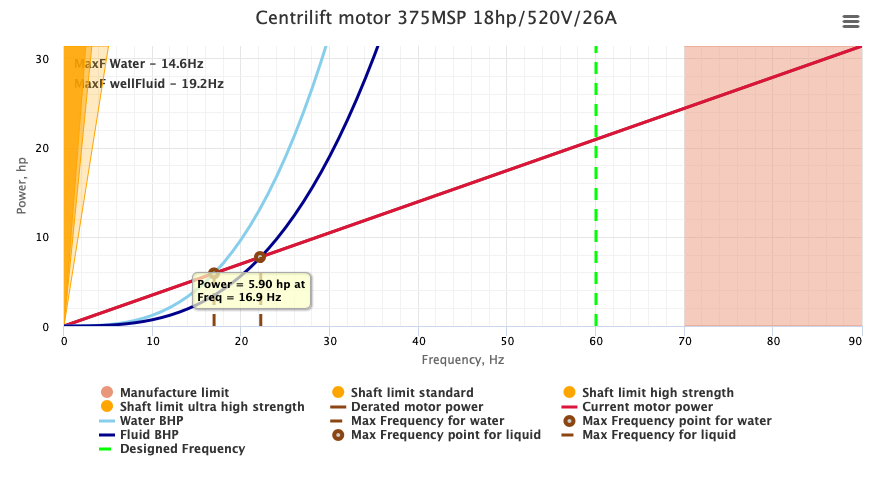
| 17:38, 6 December 2018 | ESP Motor.png (file) |  |
63 KB | Centrilift motor 375MSP 18hp/520V/26A | 1 |
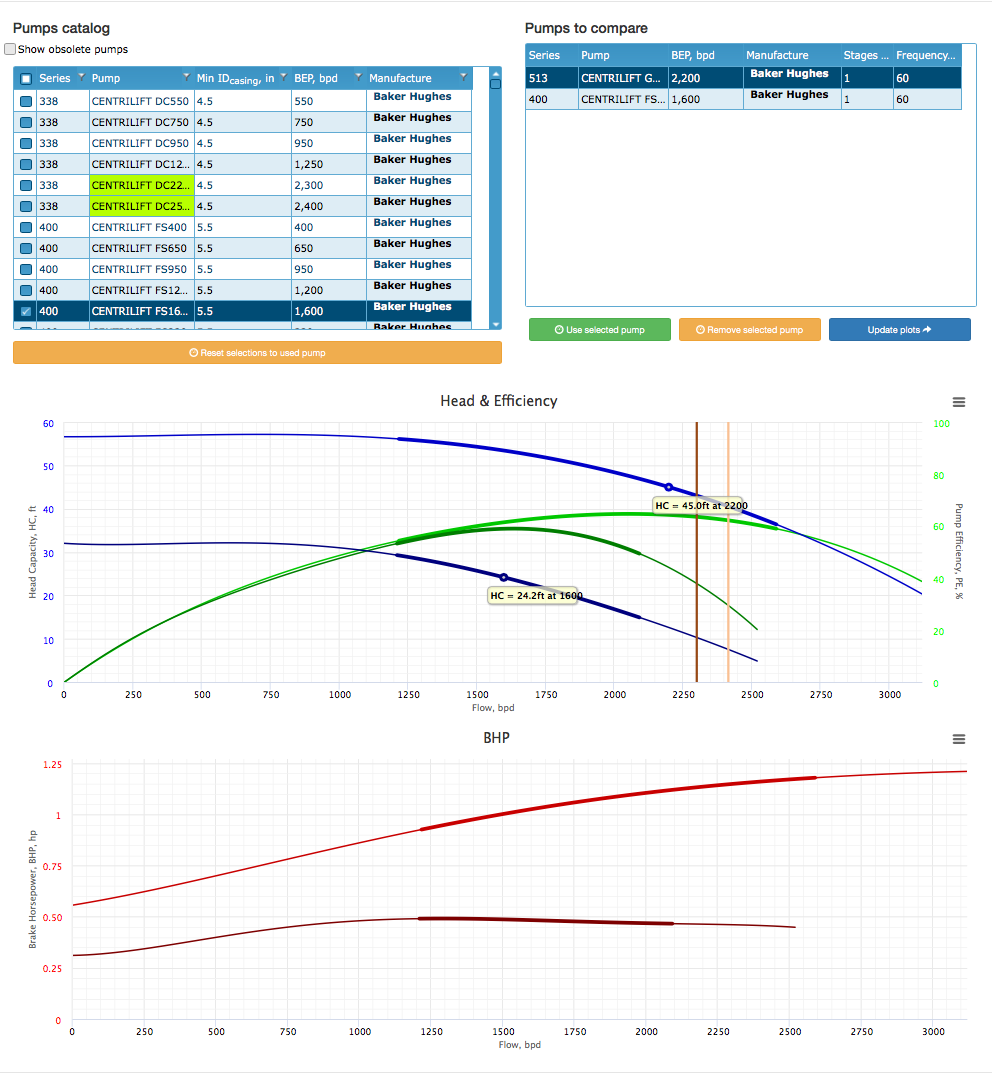
| 08:40, 10 May 2018 | ESPcatalog.png (file) |  |
139 KB | 1 | |
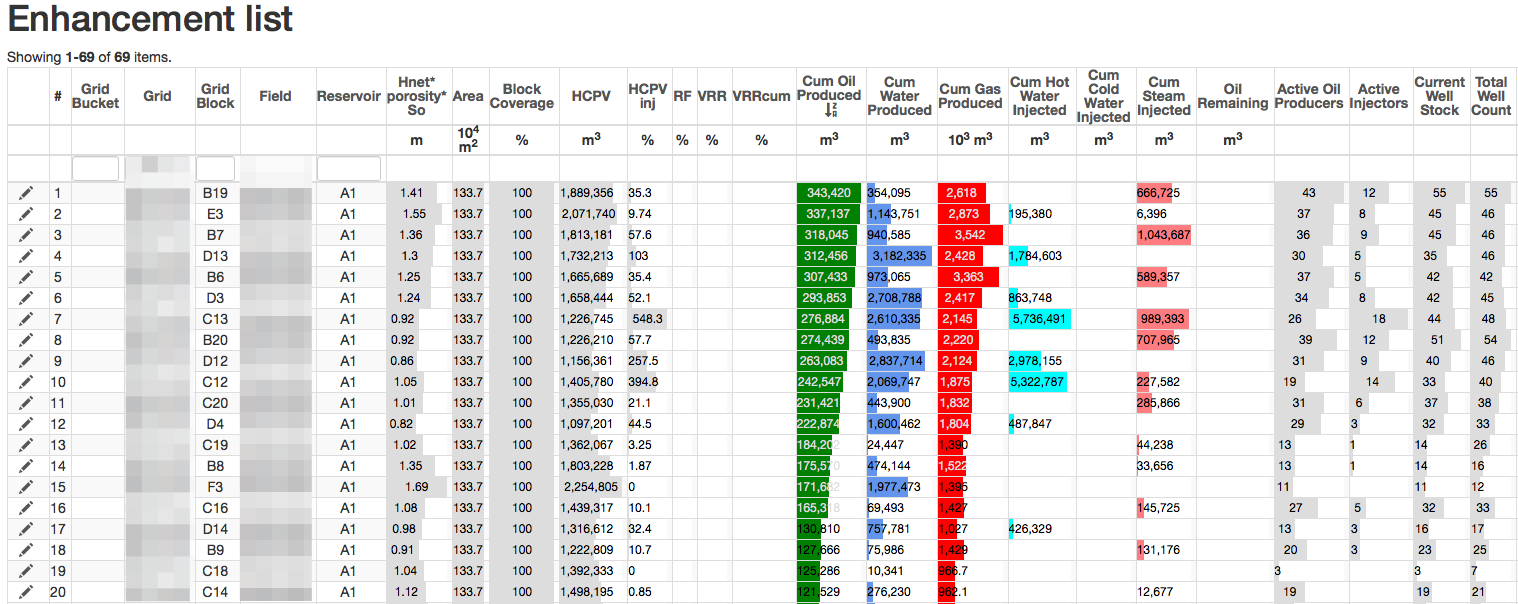
| 11:33, 27 January 2017 | EnhancementListBlocks.png (file) |  |
177 KB | Block Enhancement List | 1 |
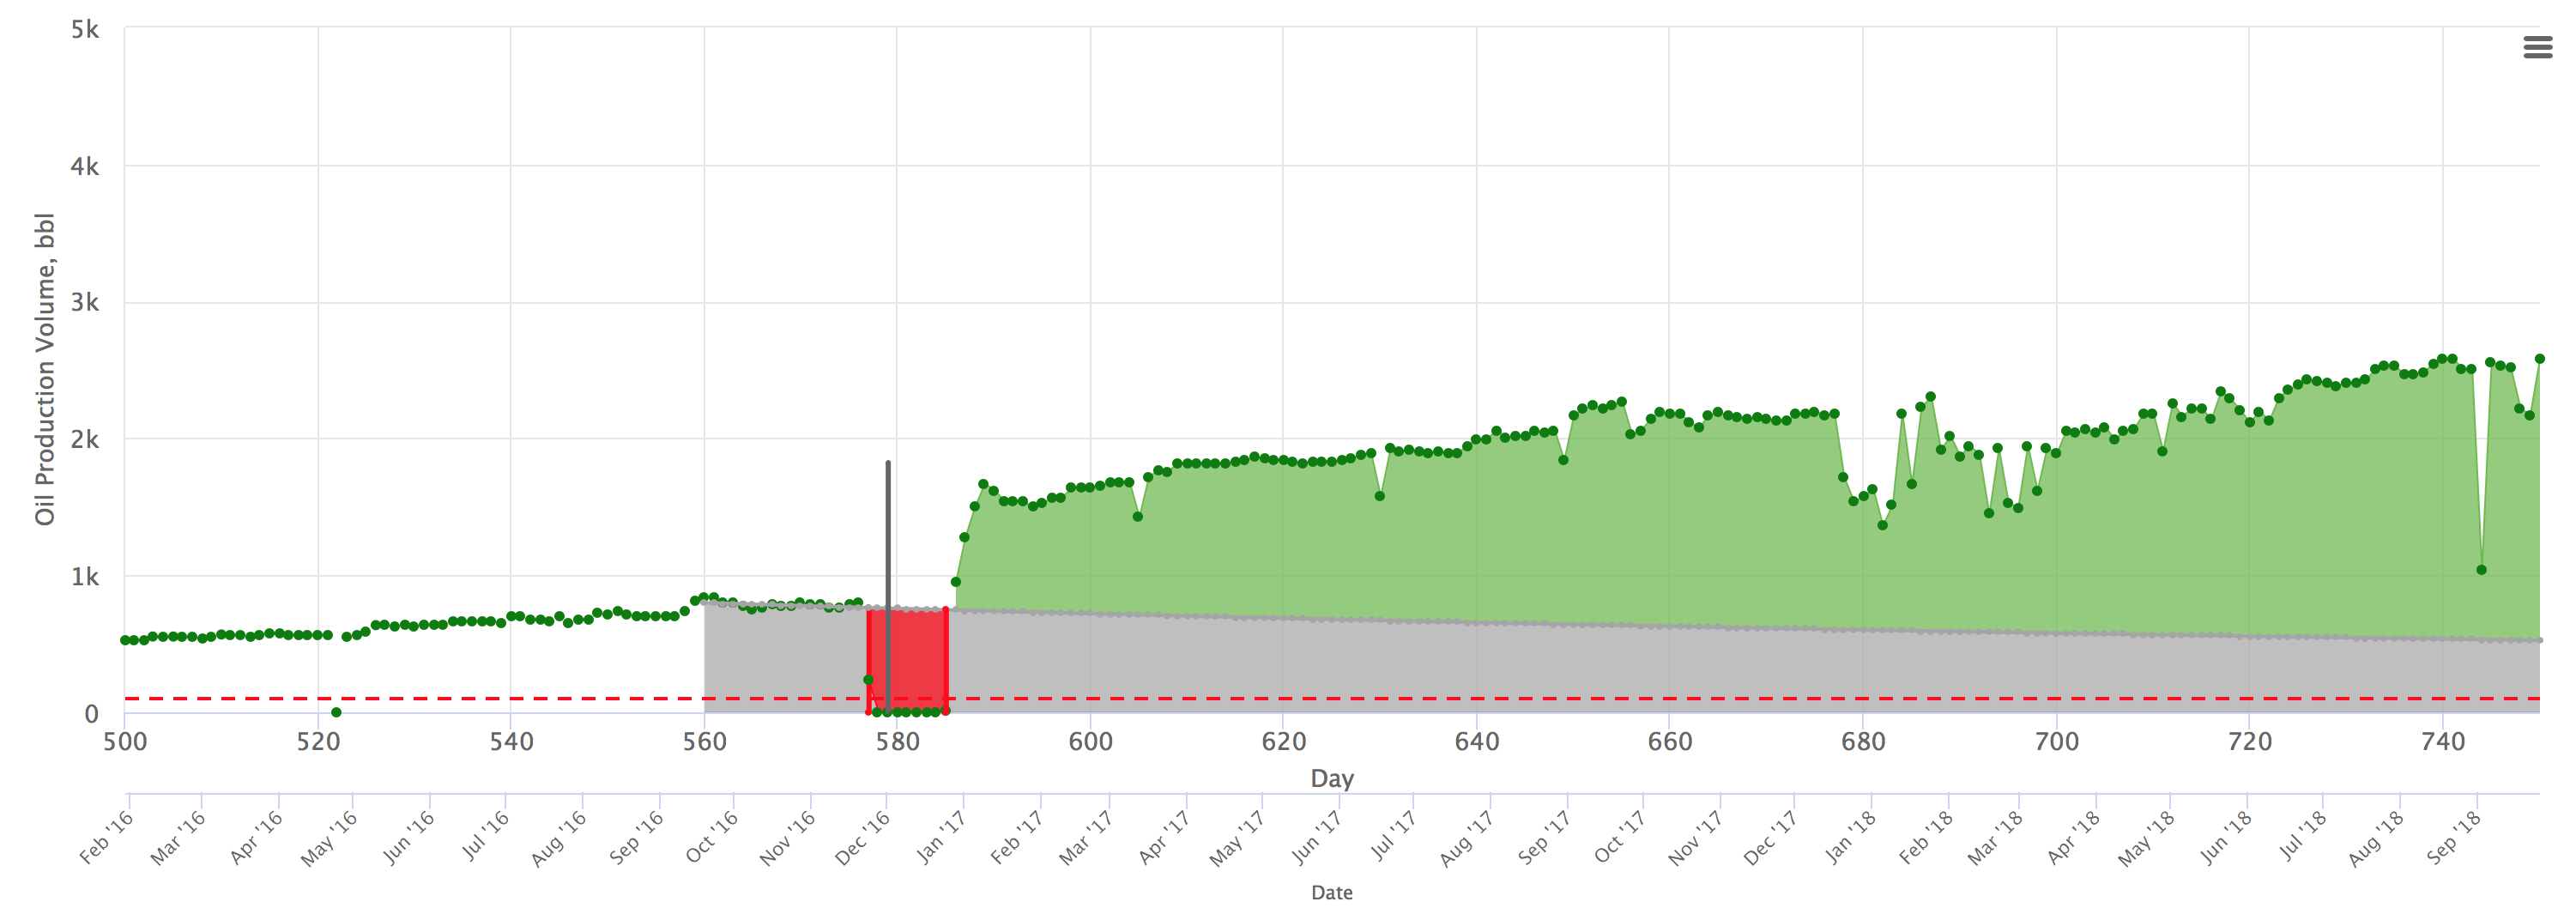
| 11:35, 10 July 2018 | Enhancement ESP.png (file) |  |
128 KB | Enhancement example: Converting the flowing well to the ESP (bbls) | 2 |
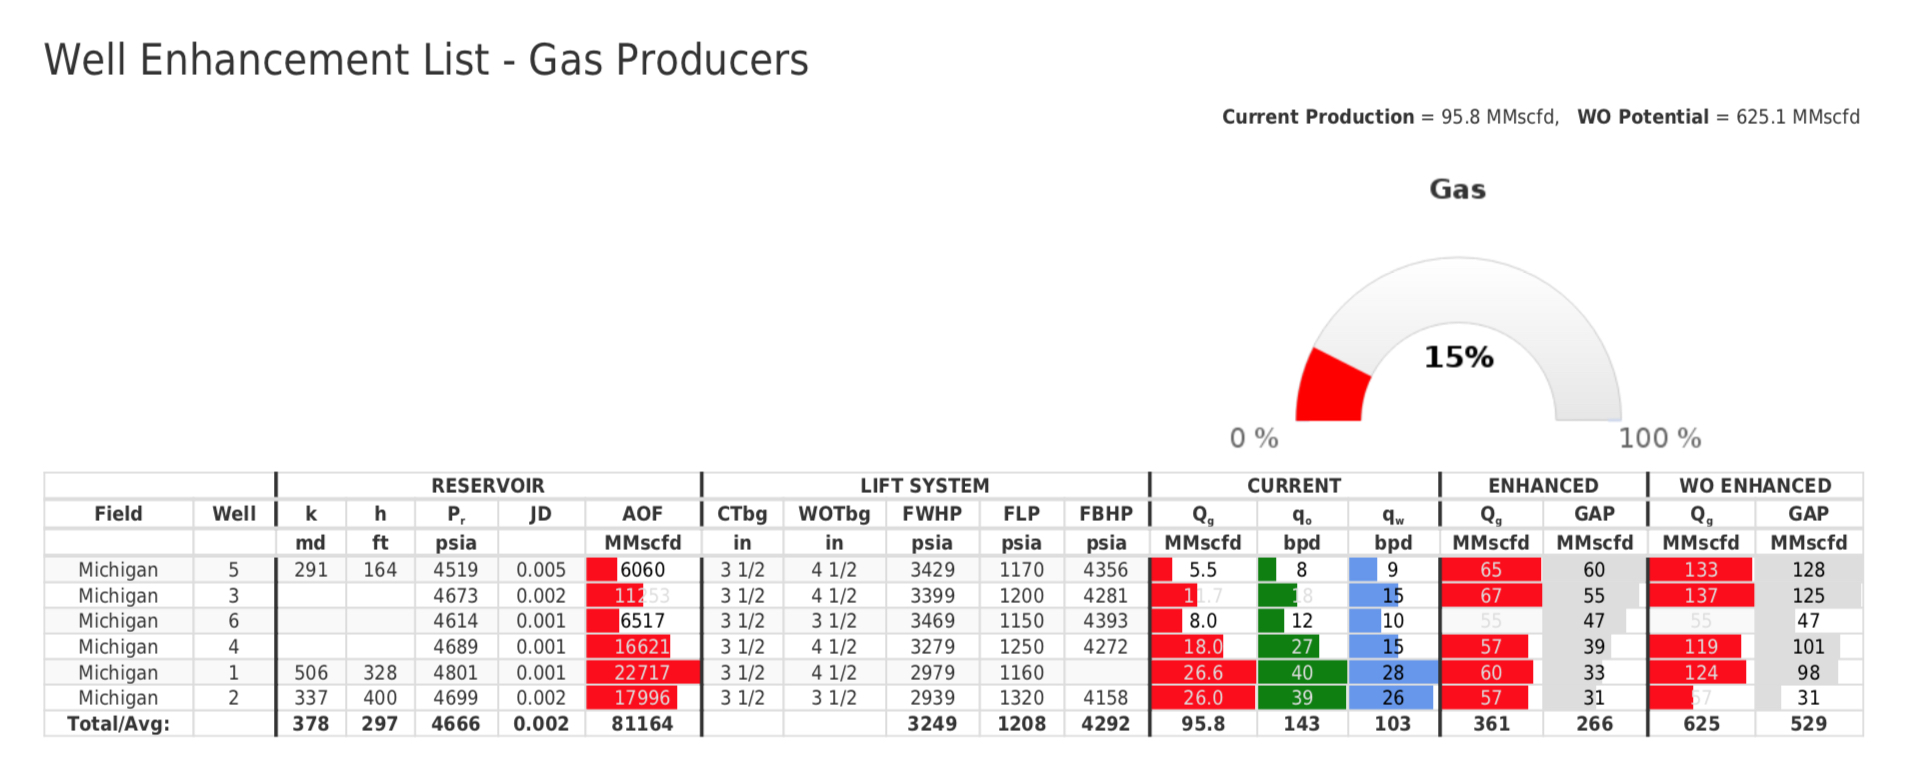
| 13:13, 31 July 2018 | Enhancement List.jpeg (file) |  |
364 KB | Well Enhancement List at E&P Portal | 1 |
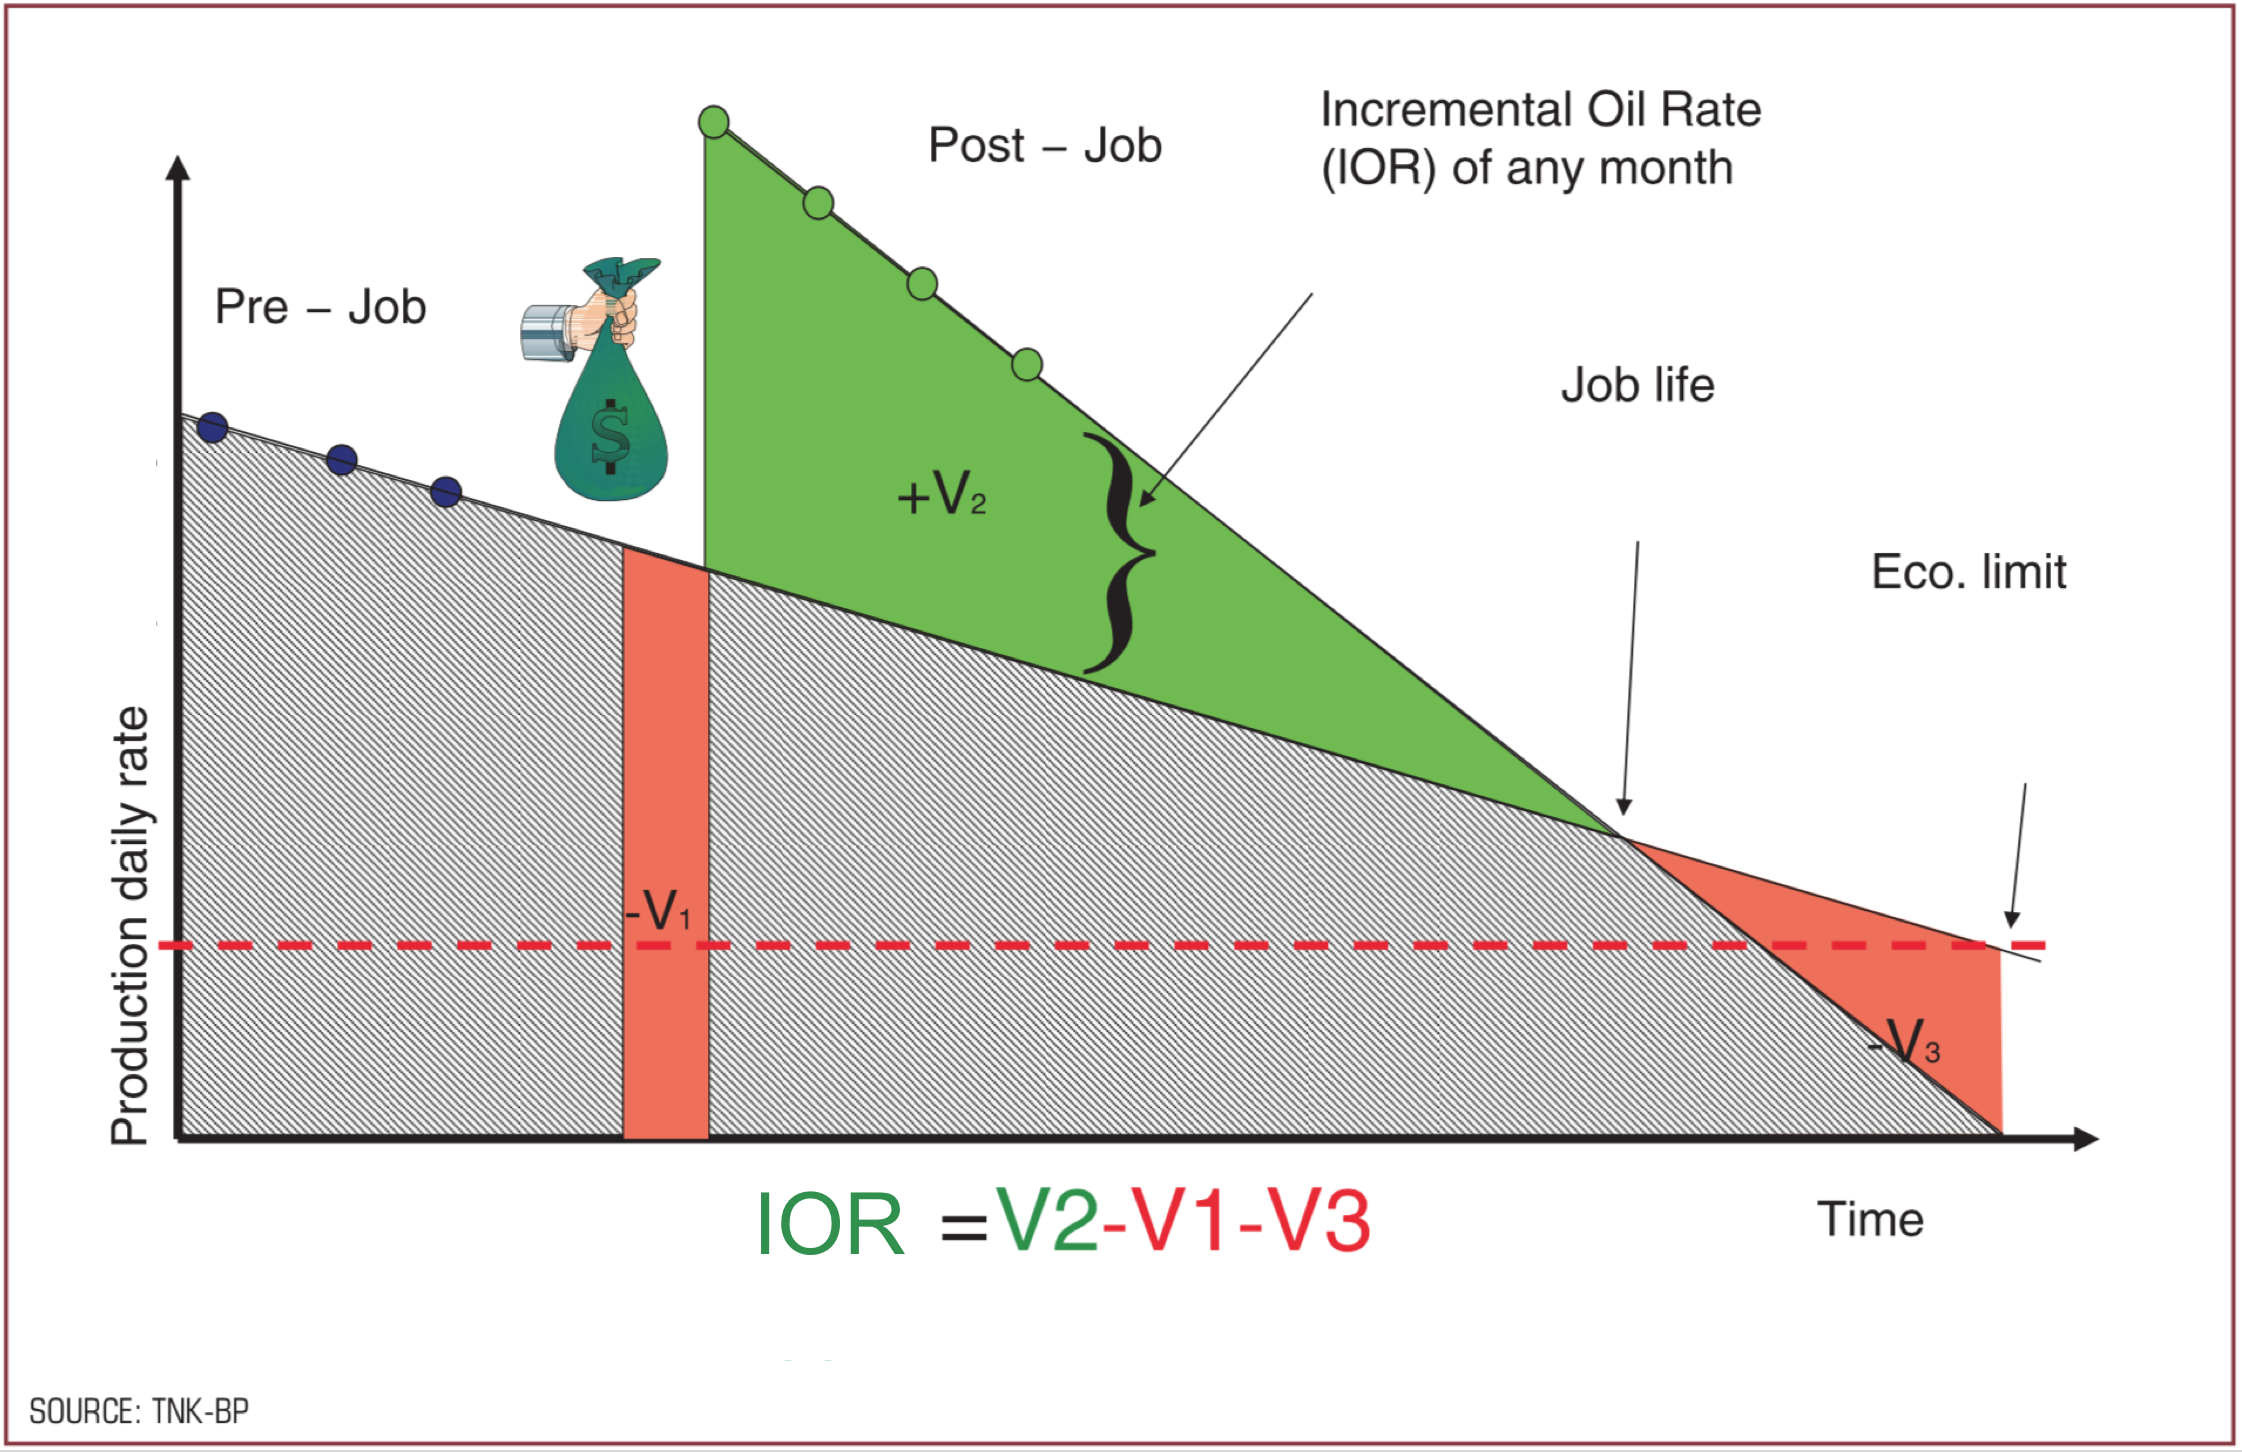
| 12:12, 28 July 2018 | Enhancement Tracking.png (file) |  |
1.46 MB | Enhancement Tracking Innovator 12, TNK-BP Technology Magazine EN only | 2 |
| 13:32, 31 July 2018 | Enhancement Tracking CaseStudy.pdf (file) | 9.51 MB | This Case Study demonstrates the application of the Enhancement Tracking workflow using the E&P Portal. The Study is based on the enhancement campaign implemented in an oil field located in Siberia, Russia. The campaign included such Enhancements as f... | 1 | |
| 14:22, 31 July 2018 | Enhancement Tracking attacments.zip (file) | 813 KB | Attachments: 1. “Huron 9 Pump Design Report.pdf”. 2. “Huron 9 Frac Design Report.pdf”. 3. “Huron 9 ESP upgrade Report.pdf”. 4. “Huron wells.csv”. 5. “Huron wells daily measures.csv”. 6. “Huron wells production forecast data.csv... | 1 | |
| 13:30, 31 July 2018 | Enhancment Tracking Case Study.png (file) |  |
508 KB | Enhancement Tracking Case Study title page | 2 |
| 08:39, 12 December 2017 | FMB.png (file) |  |
59 KB | Flowing Material Balance | 1 |
| 09:15, 12 December 2017 | FMBex1.png (file) |  |
66 KB | Flowing Material Balance example 1 | 1 |
| 09:16, 12 December 2017 | FMBex2.png (file) |  |
75 KB | Flowing Material Balance Example 2 | 1 |
| 09:29, 12 December 2017 | FMBex3.png (file) |  |
42 KB | Flowing Material Balance Example 3 | 1 |
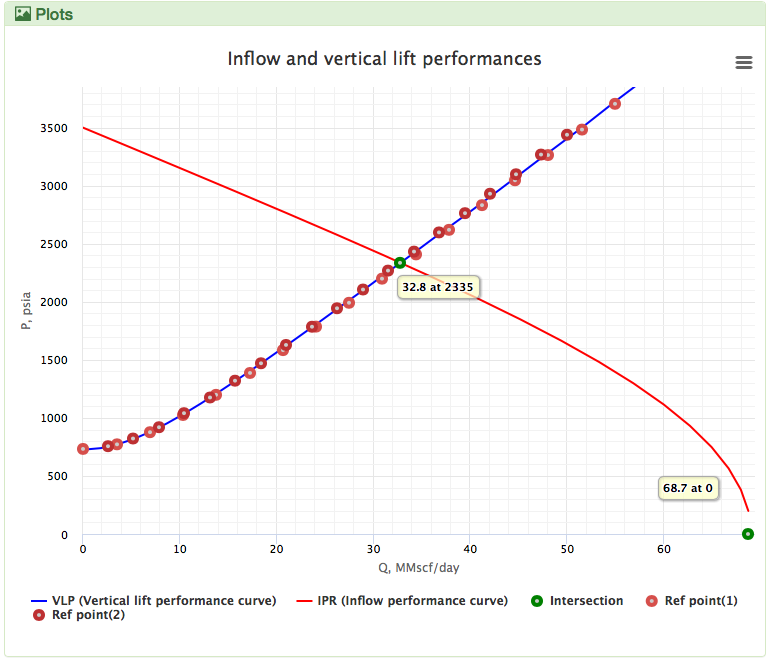
| 11:36, 18 May 2017 | Fanning.png (file) |  |
49 KB | VLP curve for dry gas by pengtools PQplot using Fanning correlation Vs Proper and Kappa | 1 |
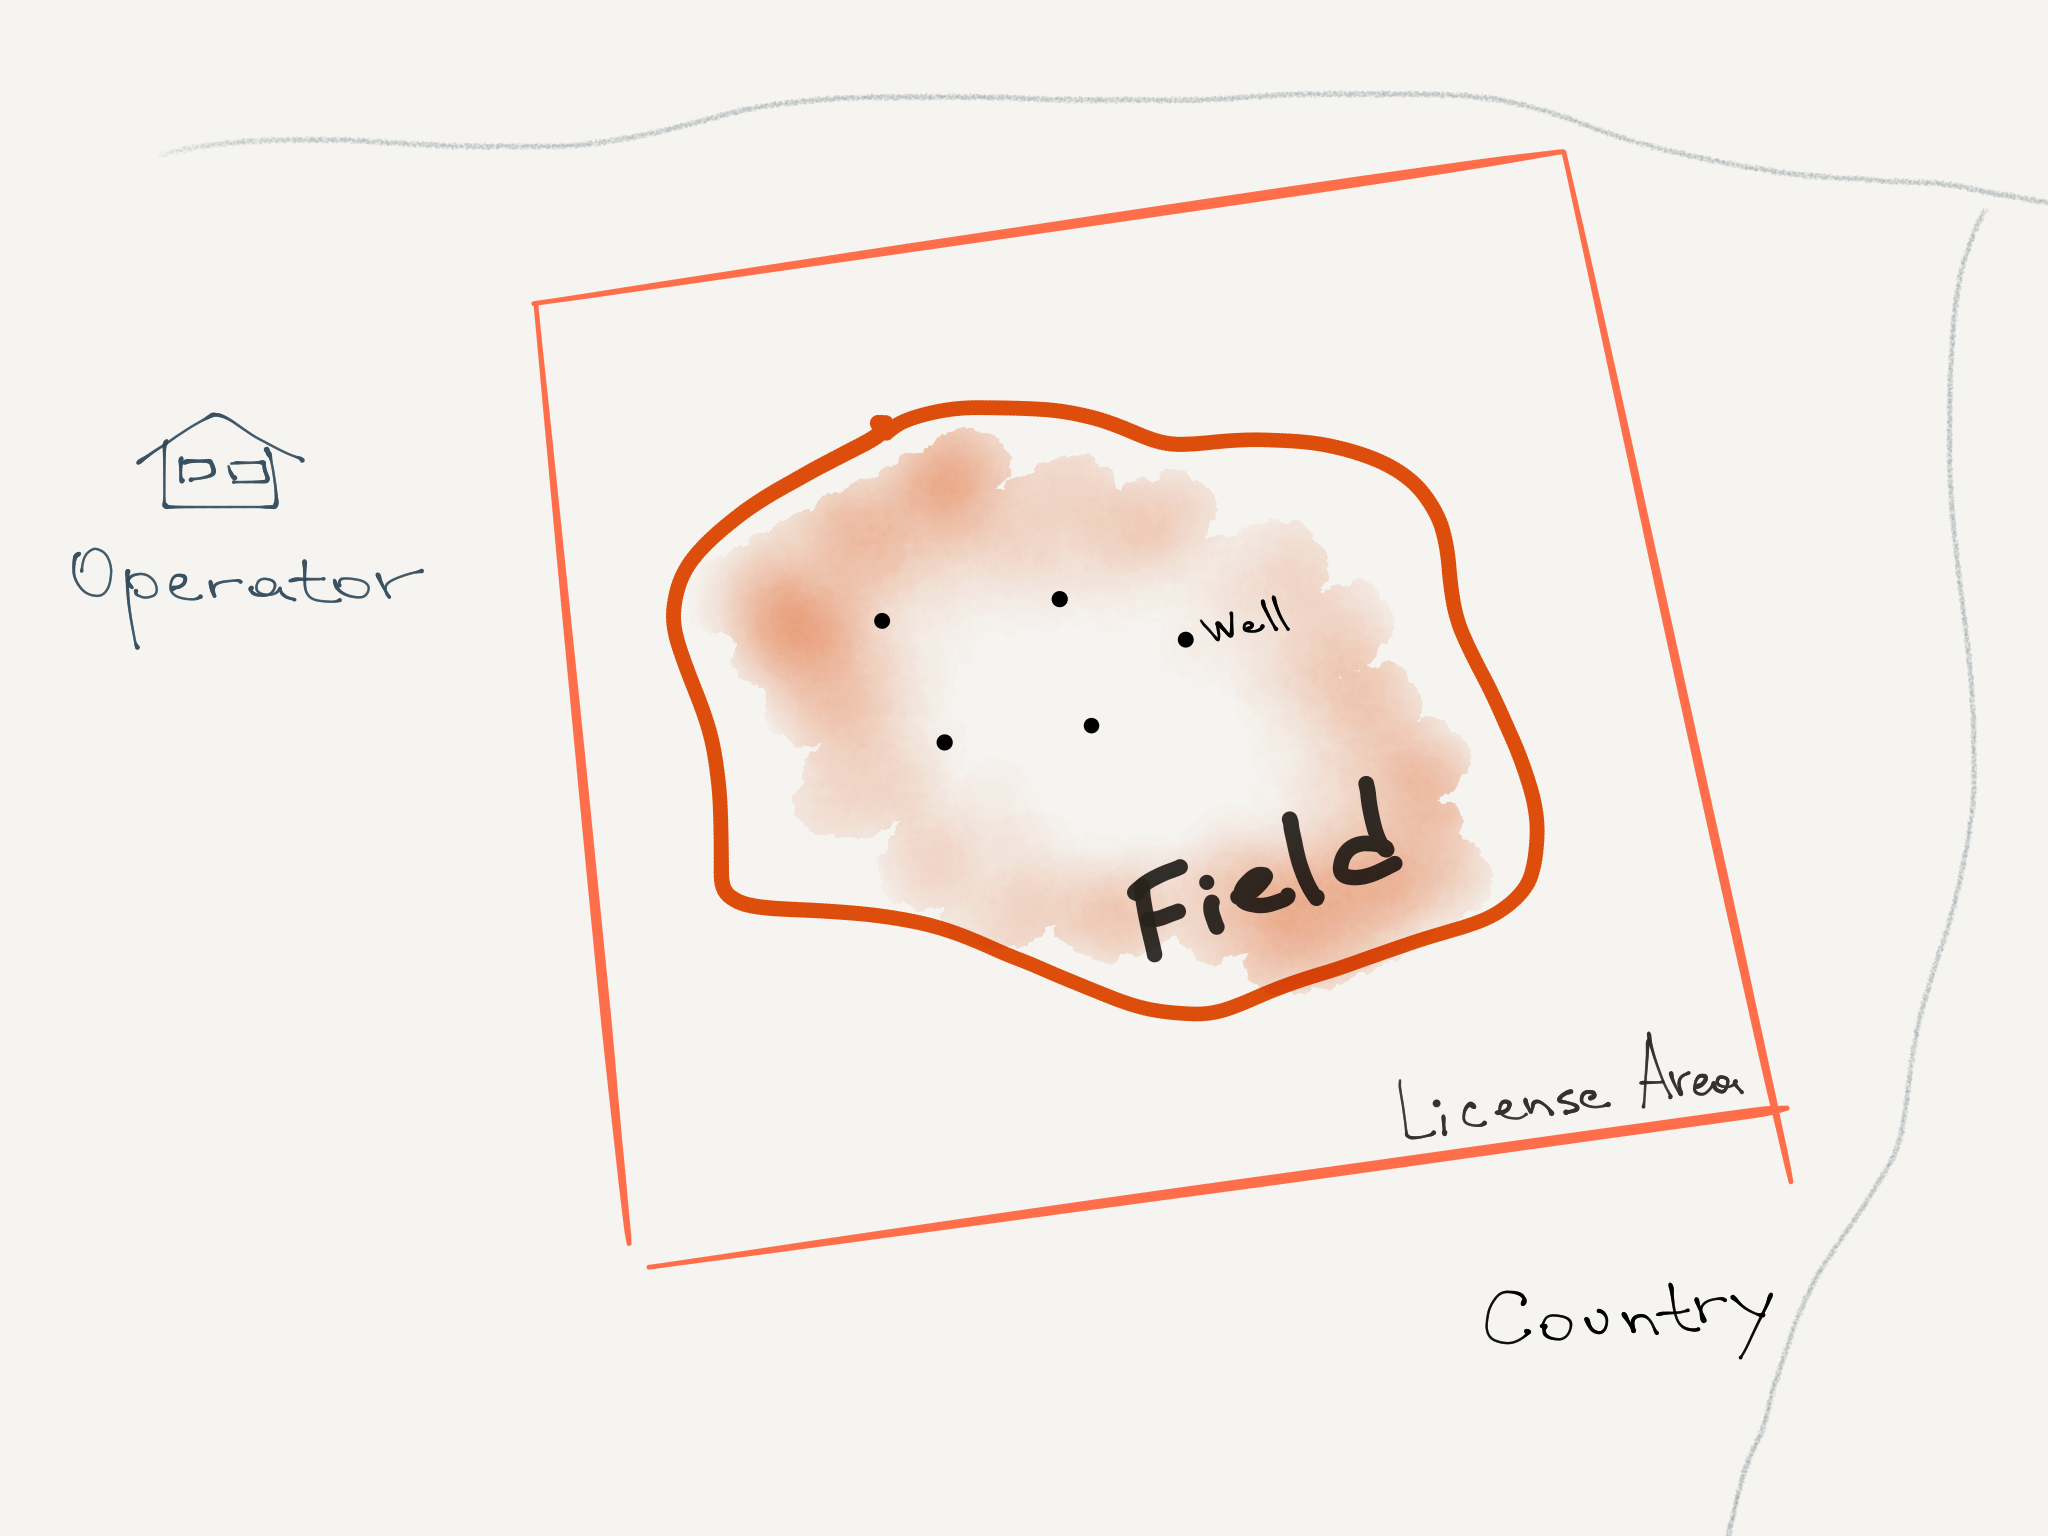
| 15:01, 6 March 2017 | Field.png (file) |  |
491 KB | Field example | 1 |
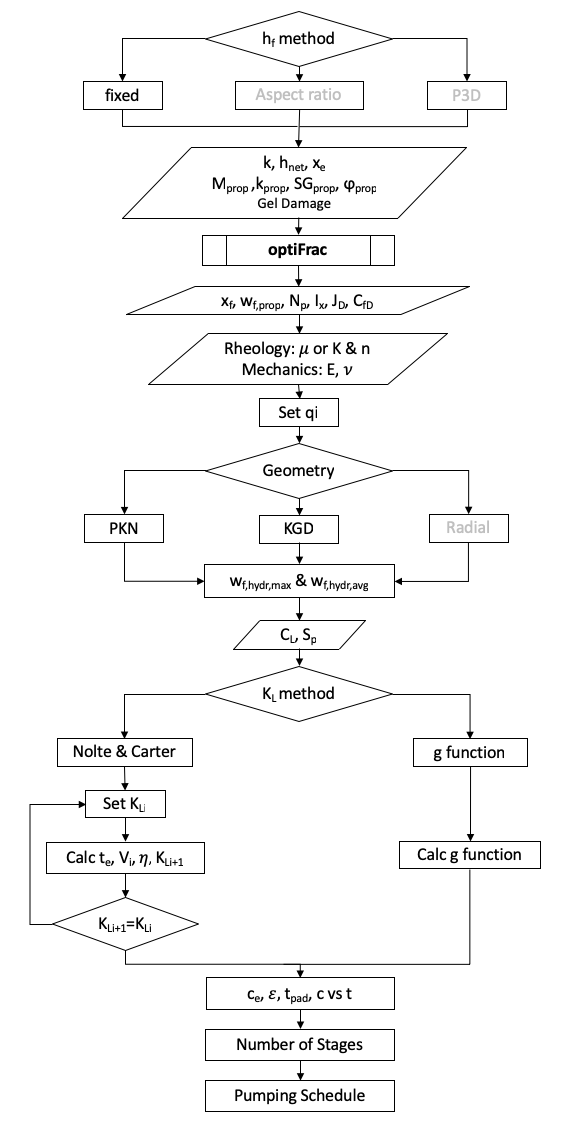
| 07:26, 12 October 2018 | FracDesign design mode flow diagram.png (file) |  |
83 KB | FracDesign design mode flow diagram | 1 |
First page |
Previous page |
Next page |
Last page |