File list
This special page shows all uploaded files.
First page |
Previous page |
Next page |
Last page |
| Date | Name | Thumbnail | Size | Description | Versions |
|---|---|---|---|---|---|
| 11:28, 27 January 2017 | MWFA.png (file) |  |
672 KB | Mature Water Flood Analysis | 1 |
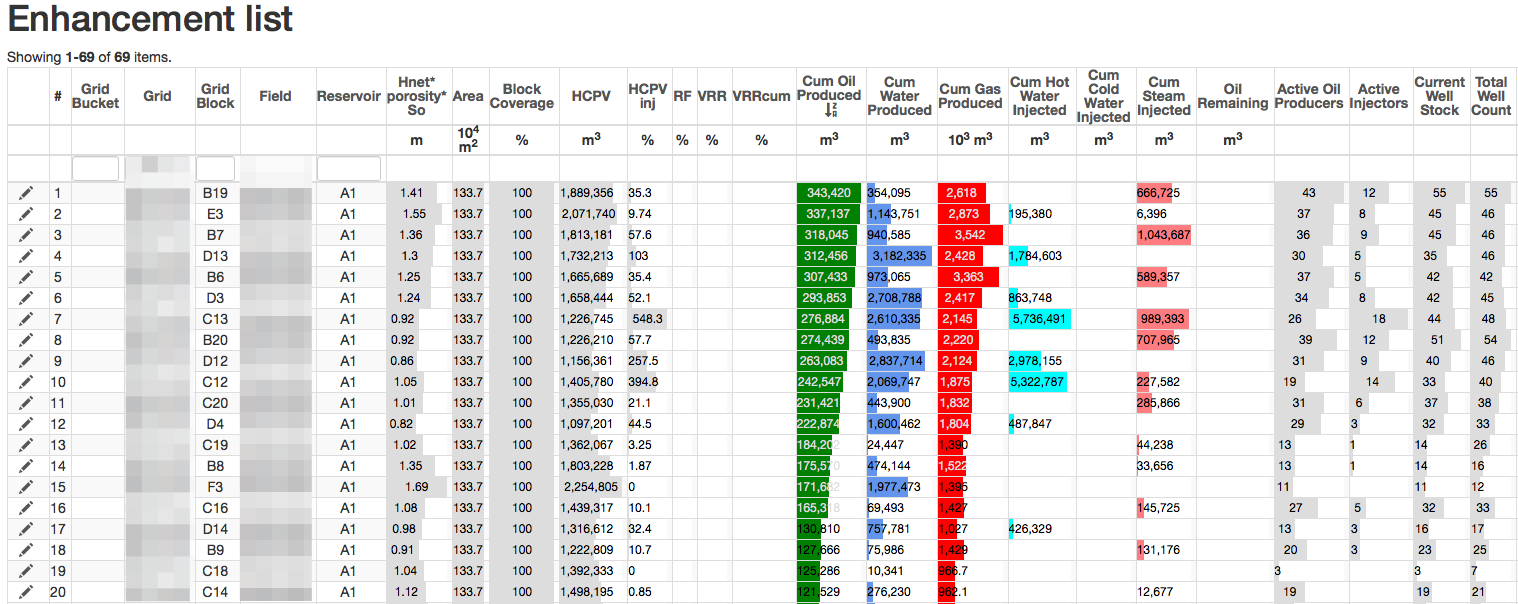
| 11:33, 27 January 2017 | EnhancementListBlocks.png (file) |  |
177 KB | Block Enhancement List | 1 |
| 21:18, 3 February 2017 | Reservoir Management.png (file) | 170 KB | 2 | ||
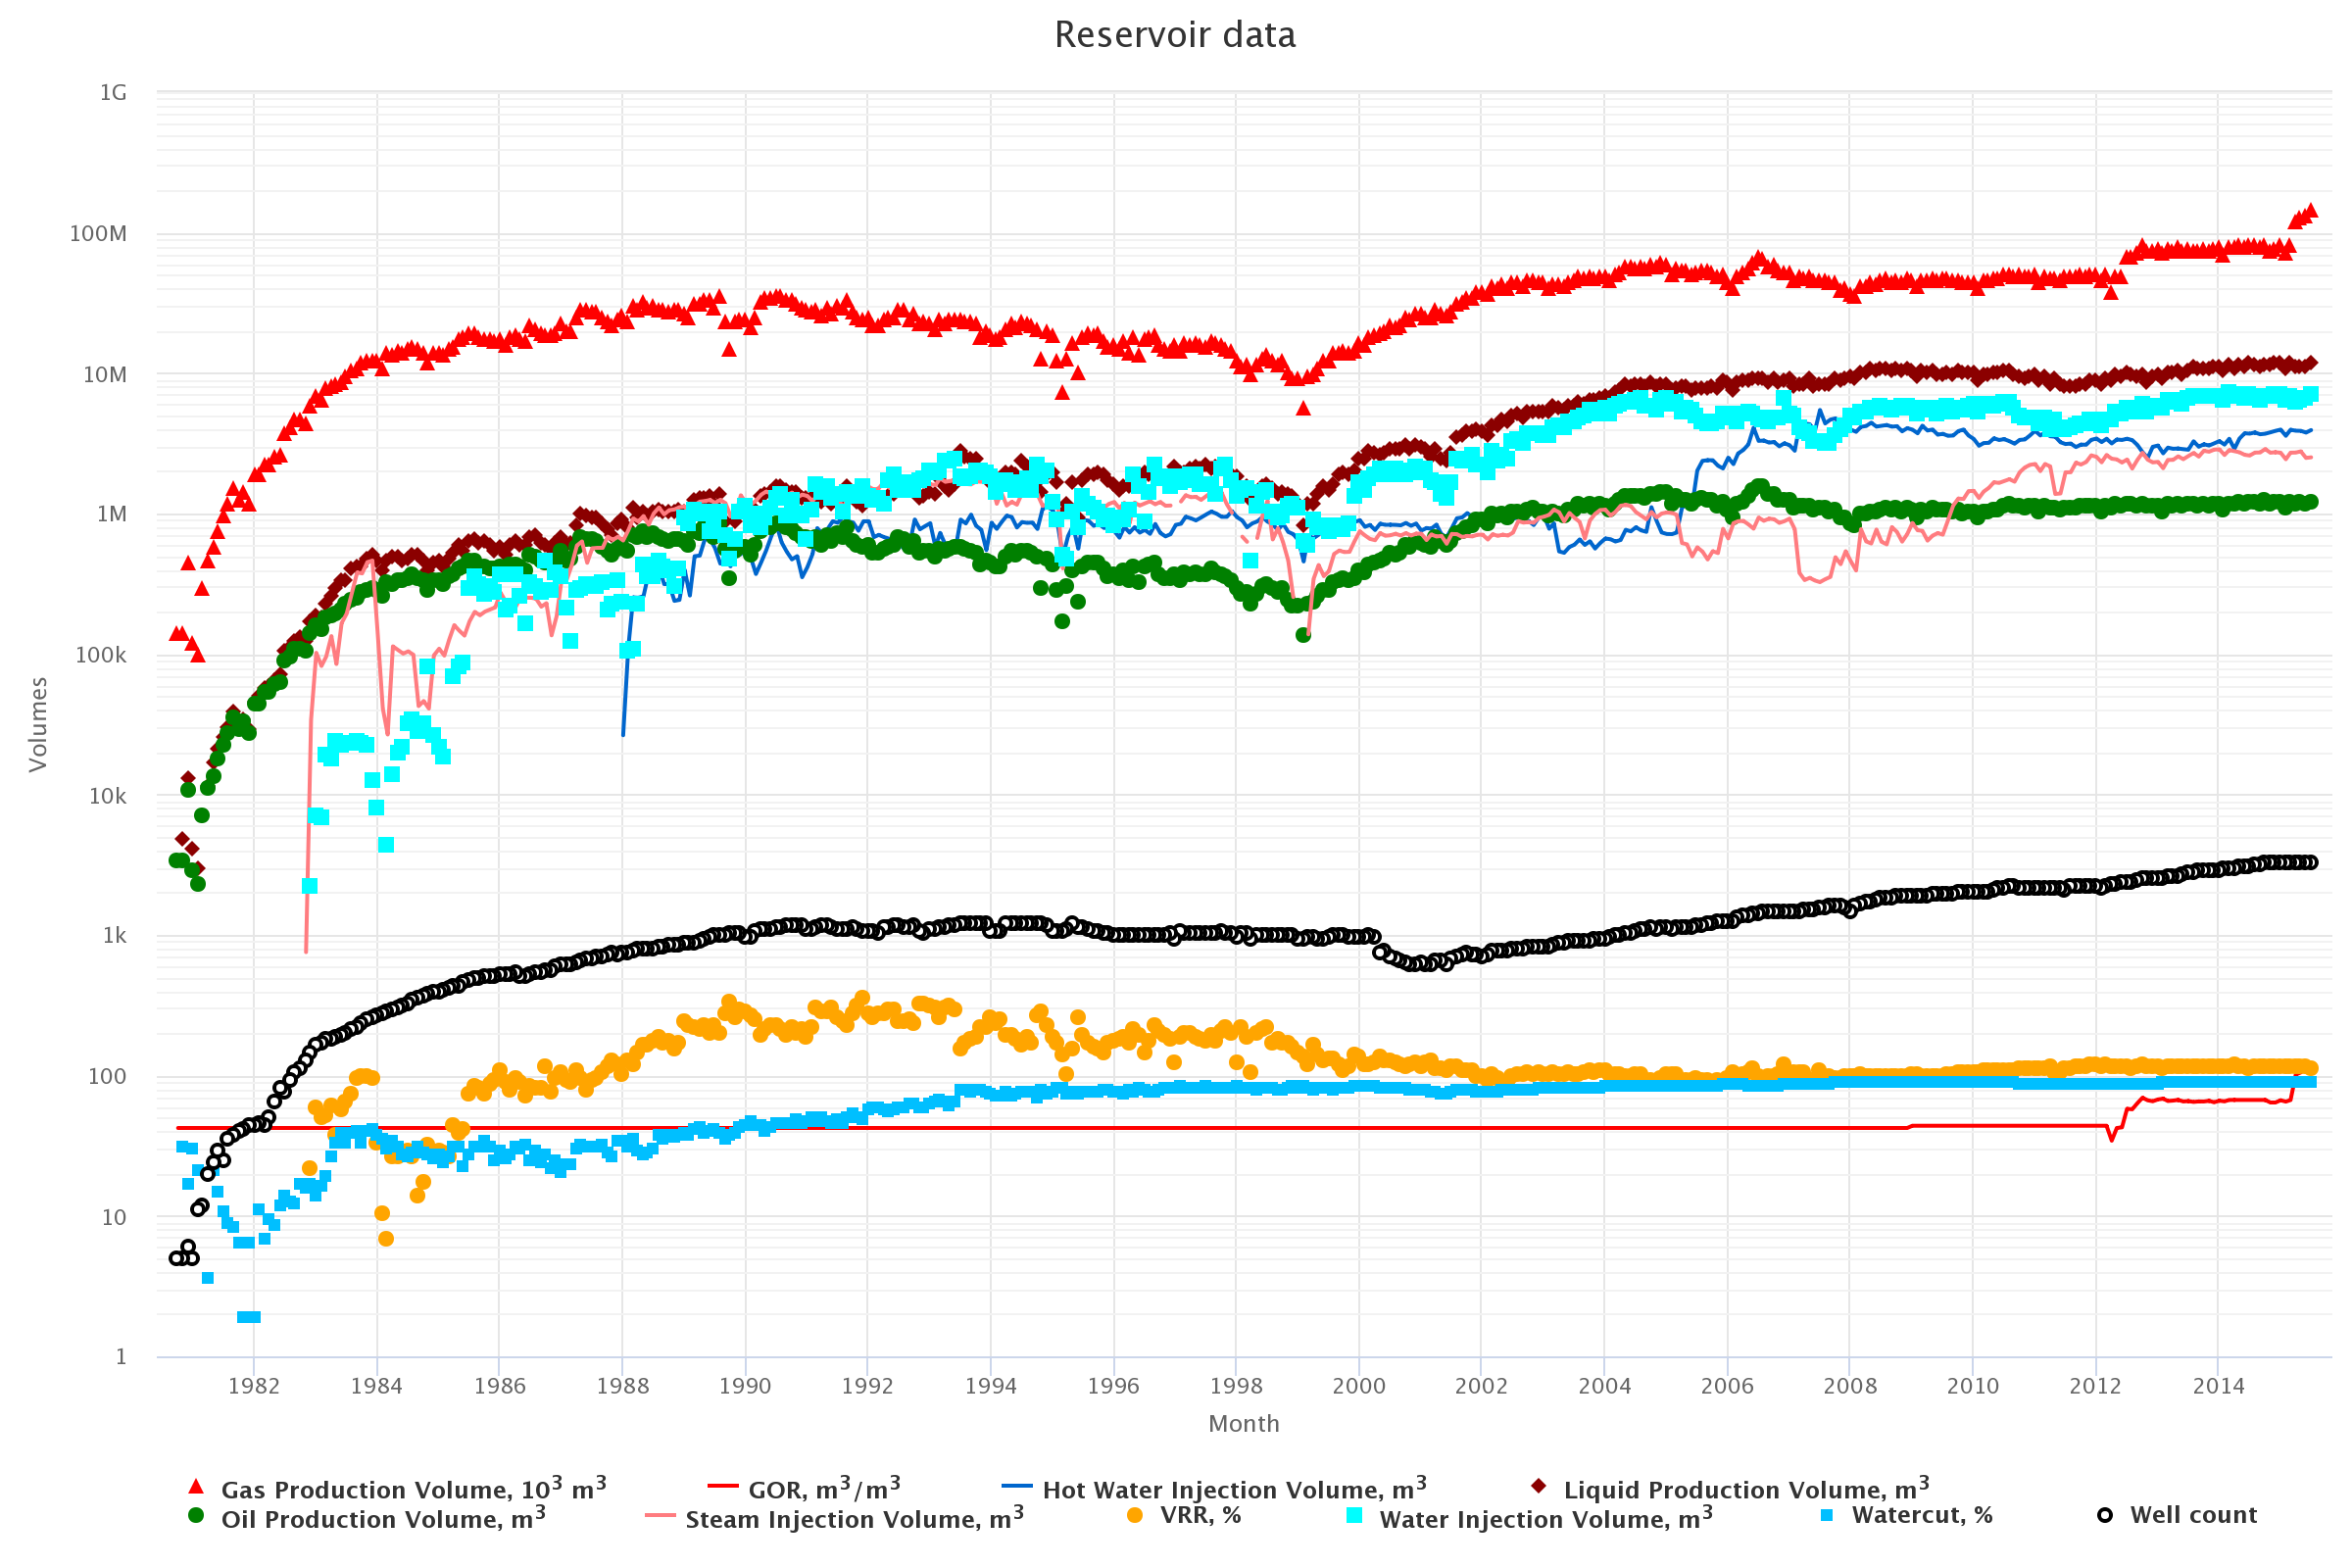
| 21:20, 3 February 2017 | History Plot.png (file) |  |
251 KB | 2 | |
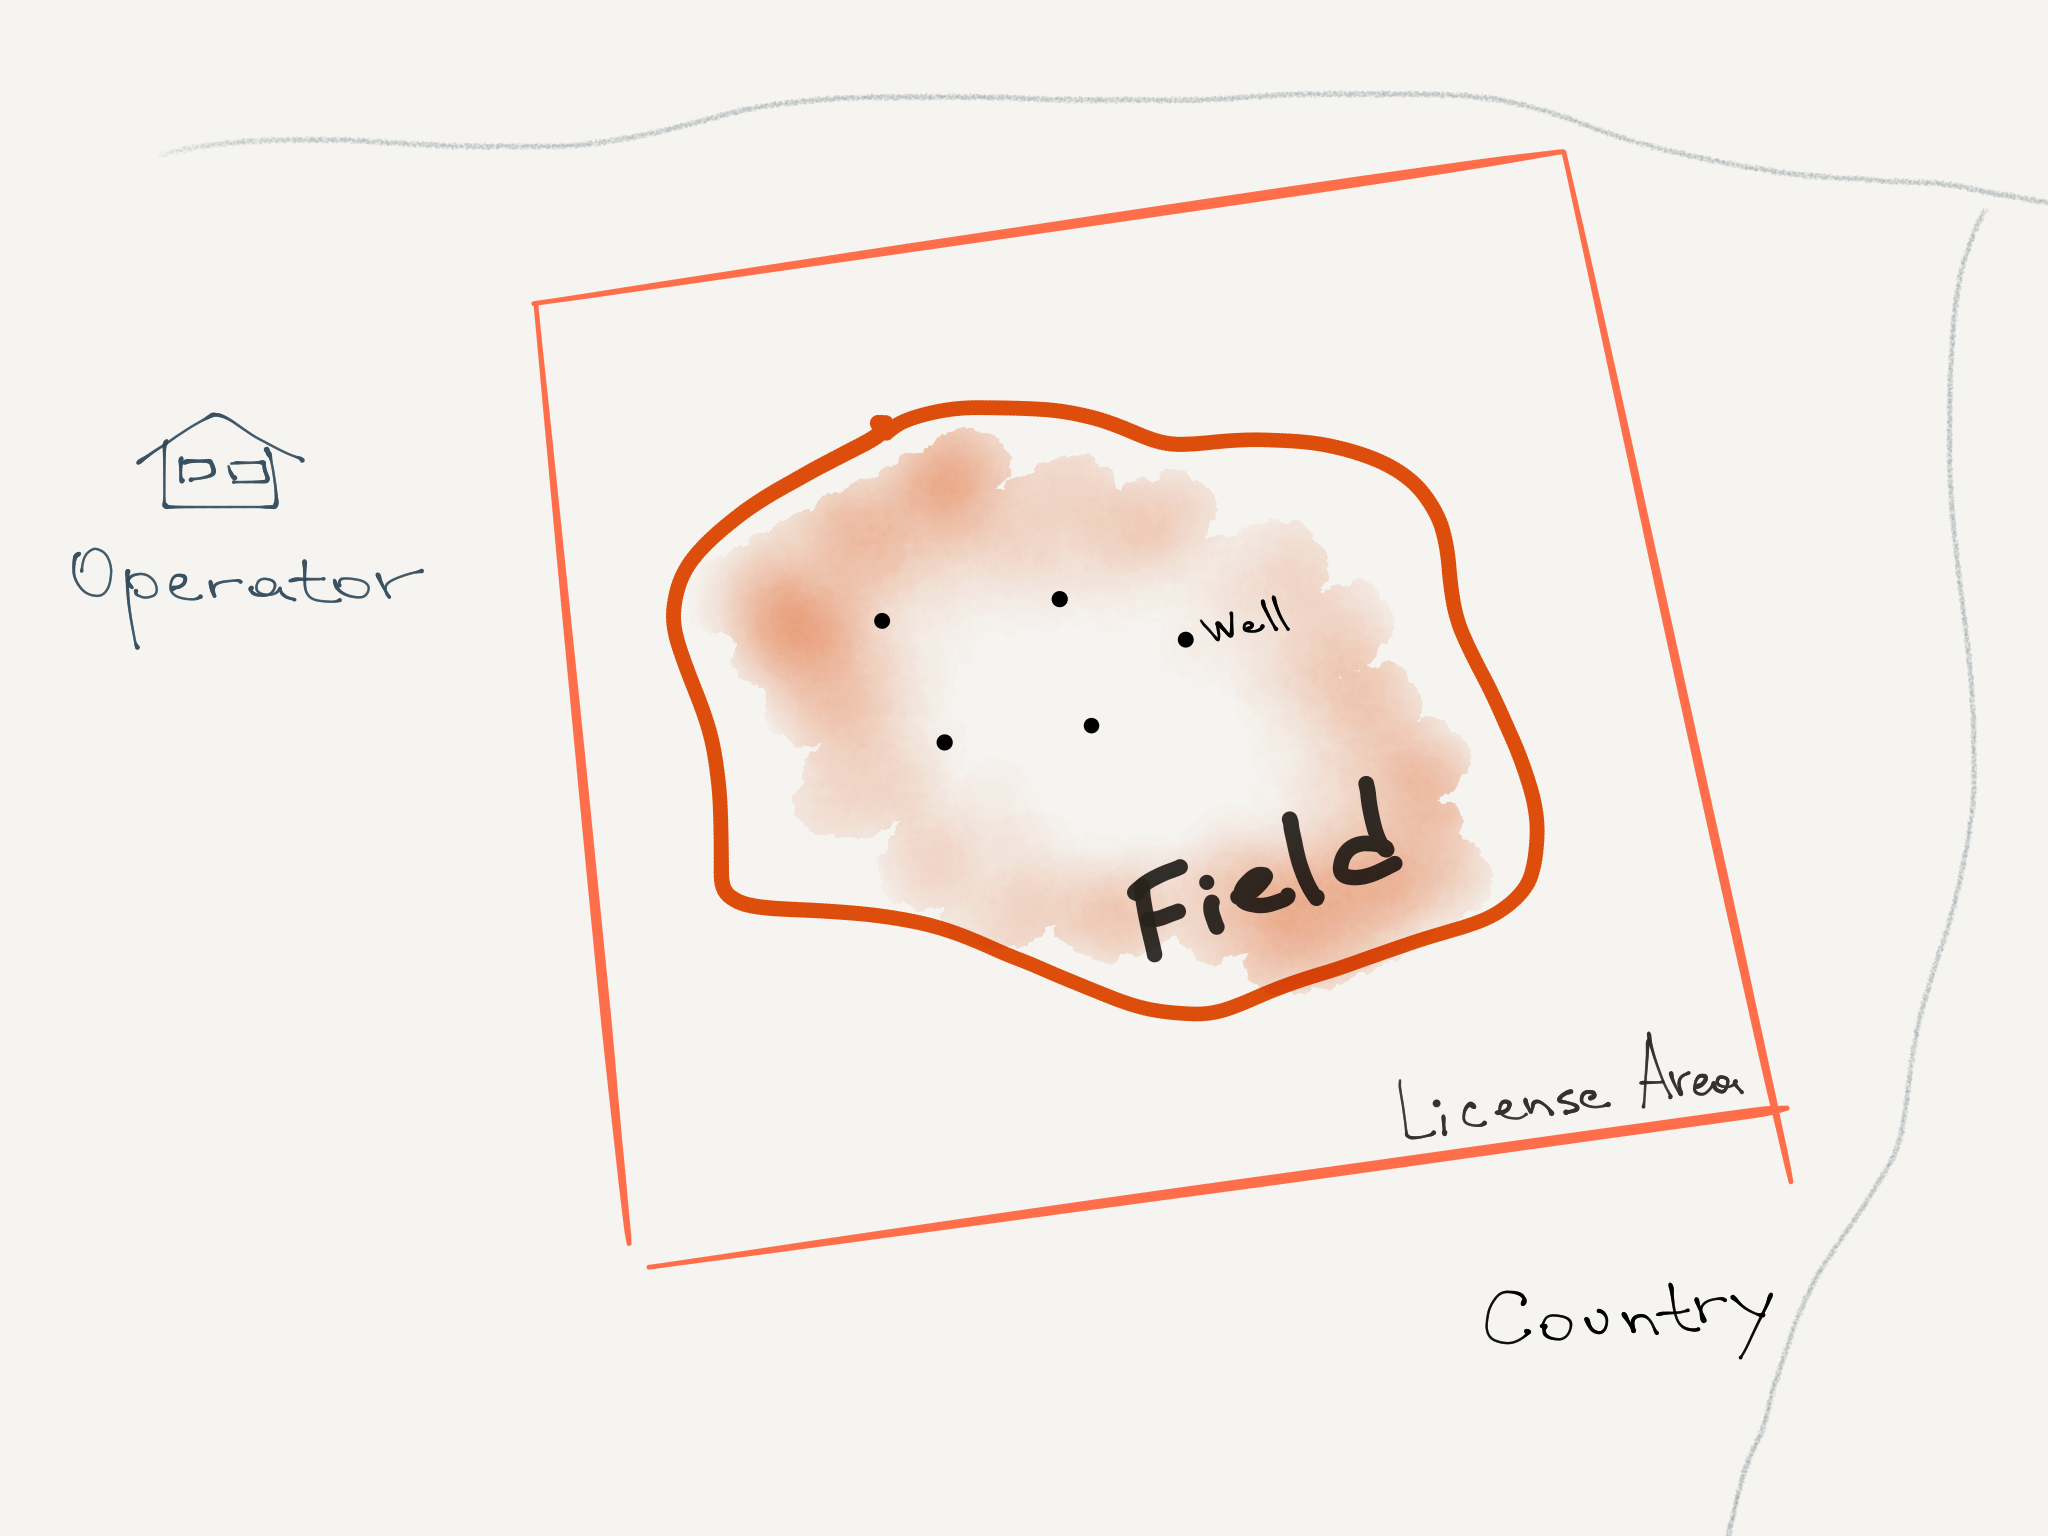
| 15:01, 6 March 2017 | Field.png (file) |  |
491 KB | Field example | 1 |
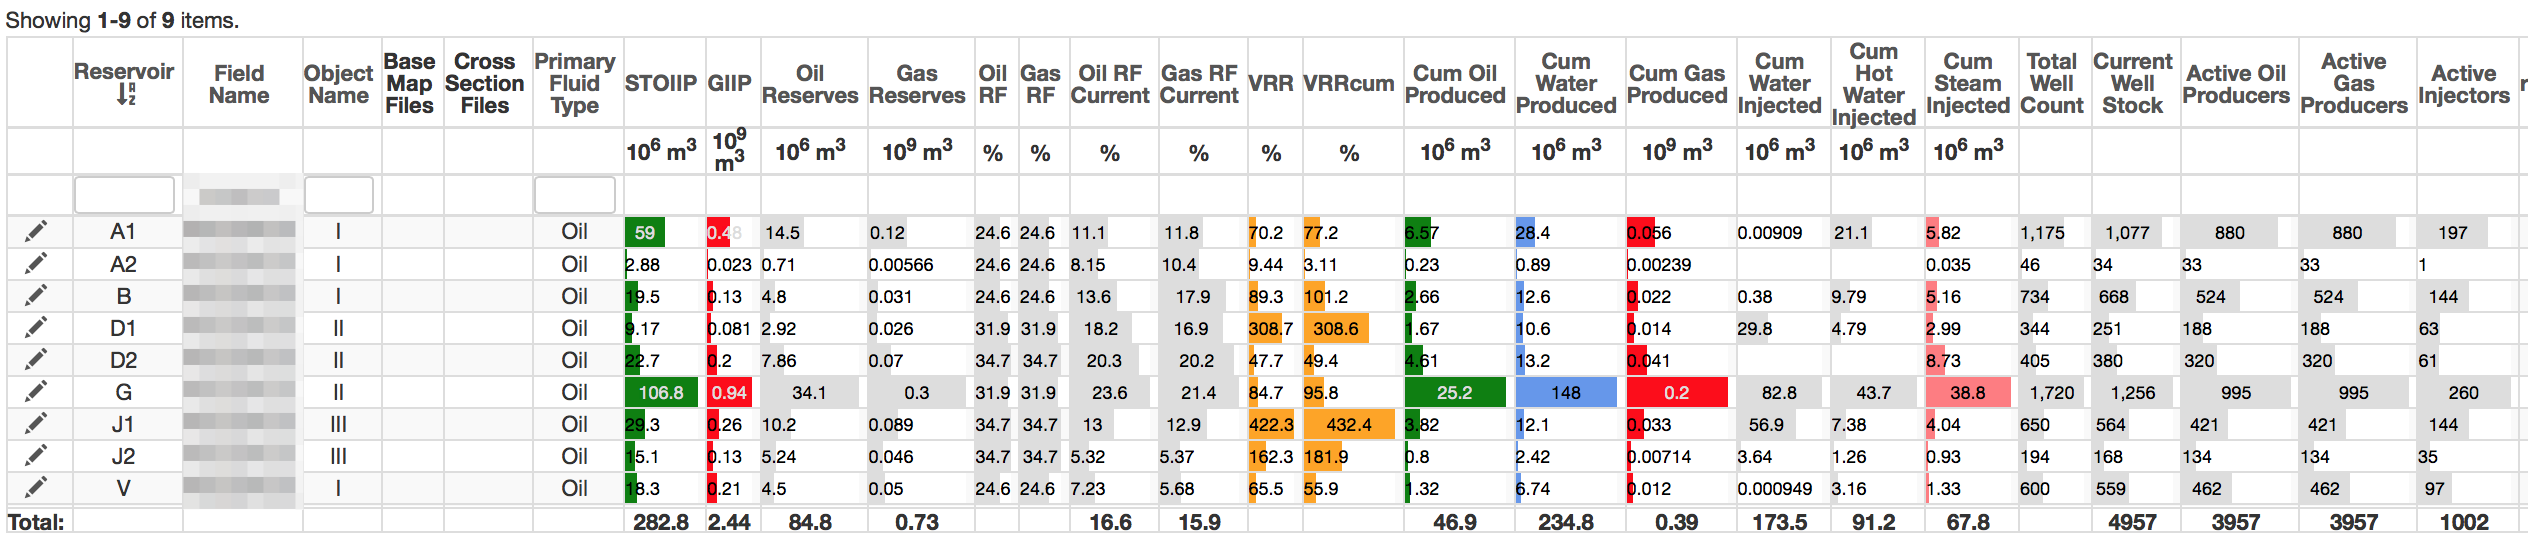
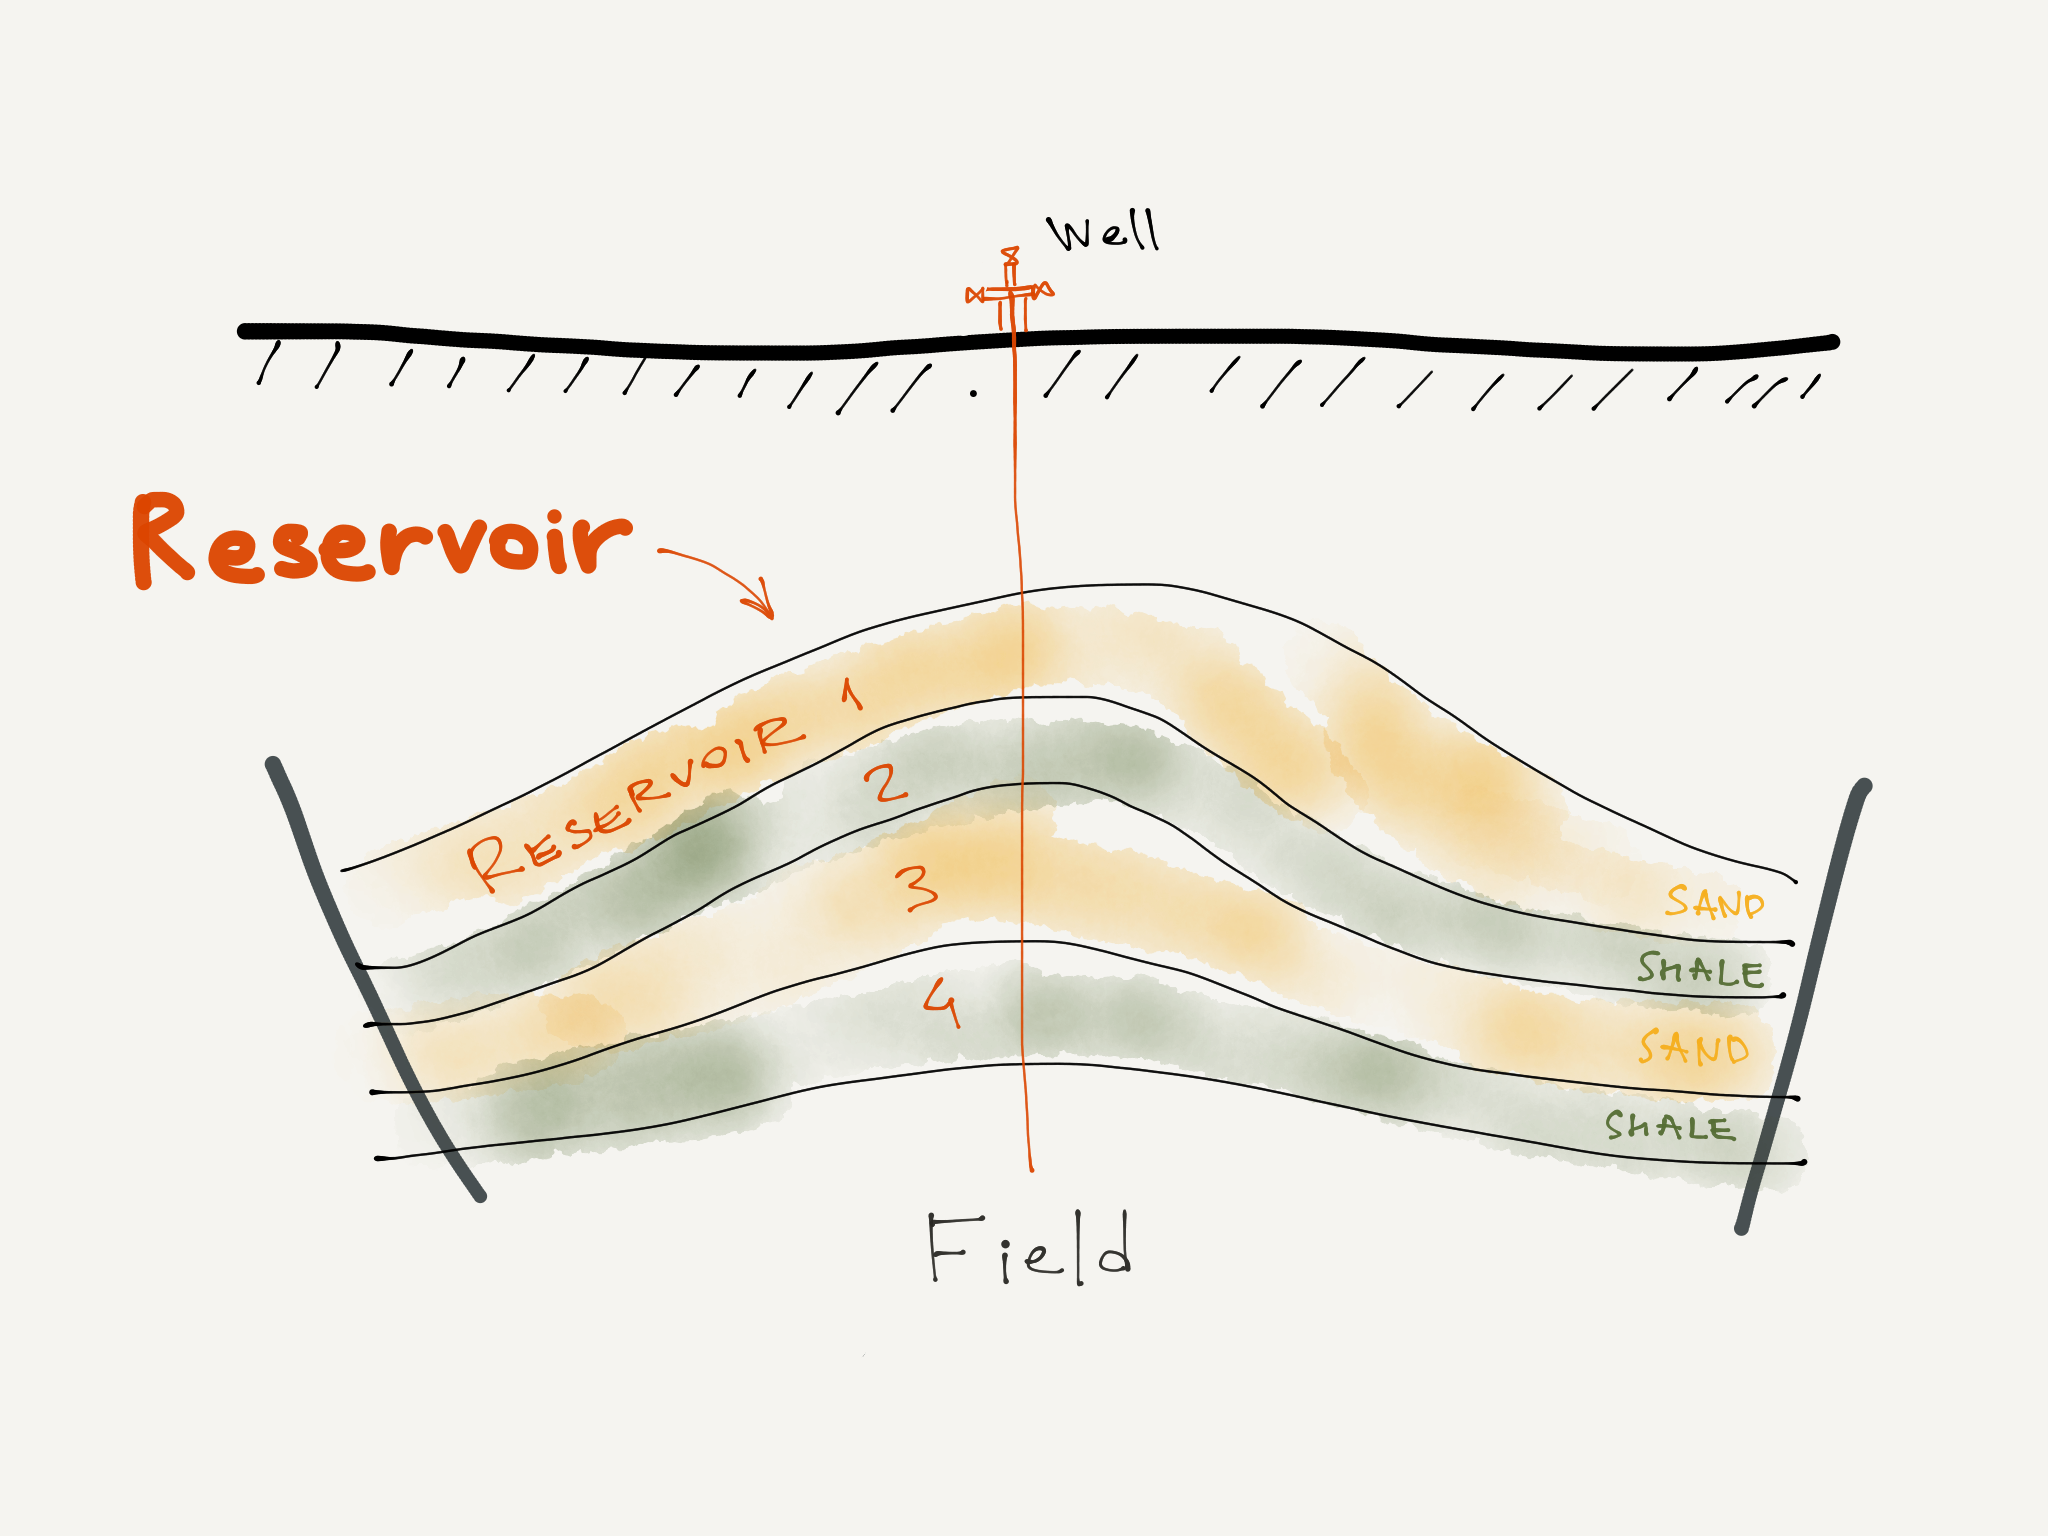
| 15:28, 6 March 2017 | Reservoir.png (file) |  |
785 KB | Reservoirs example | 1 |
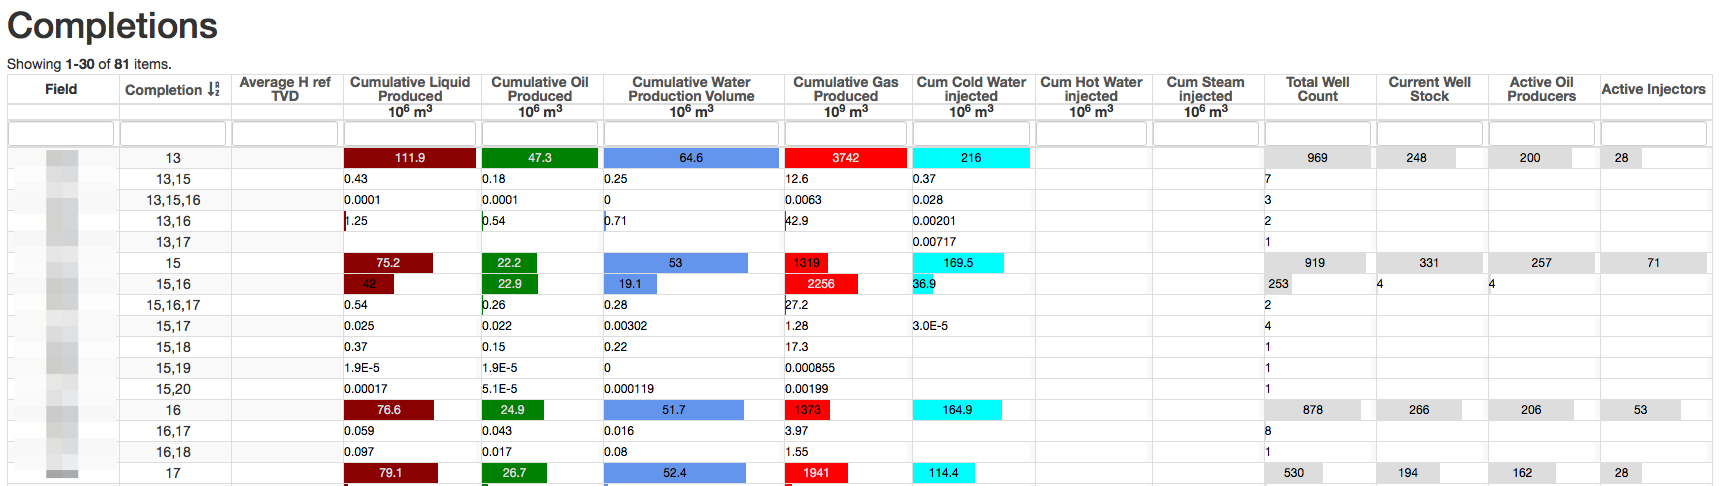
| 15:55, 6 March 2017 | Completion check.png (file) |  |
77 KB | 1 | |
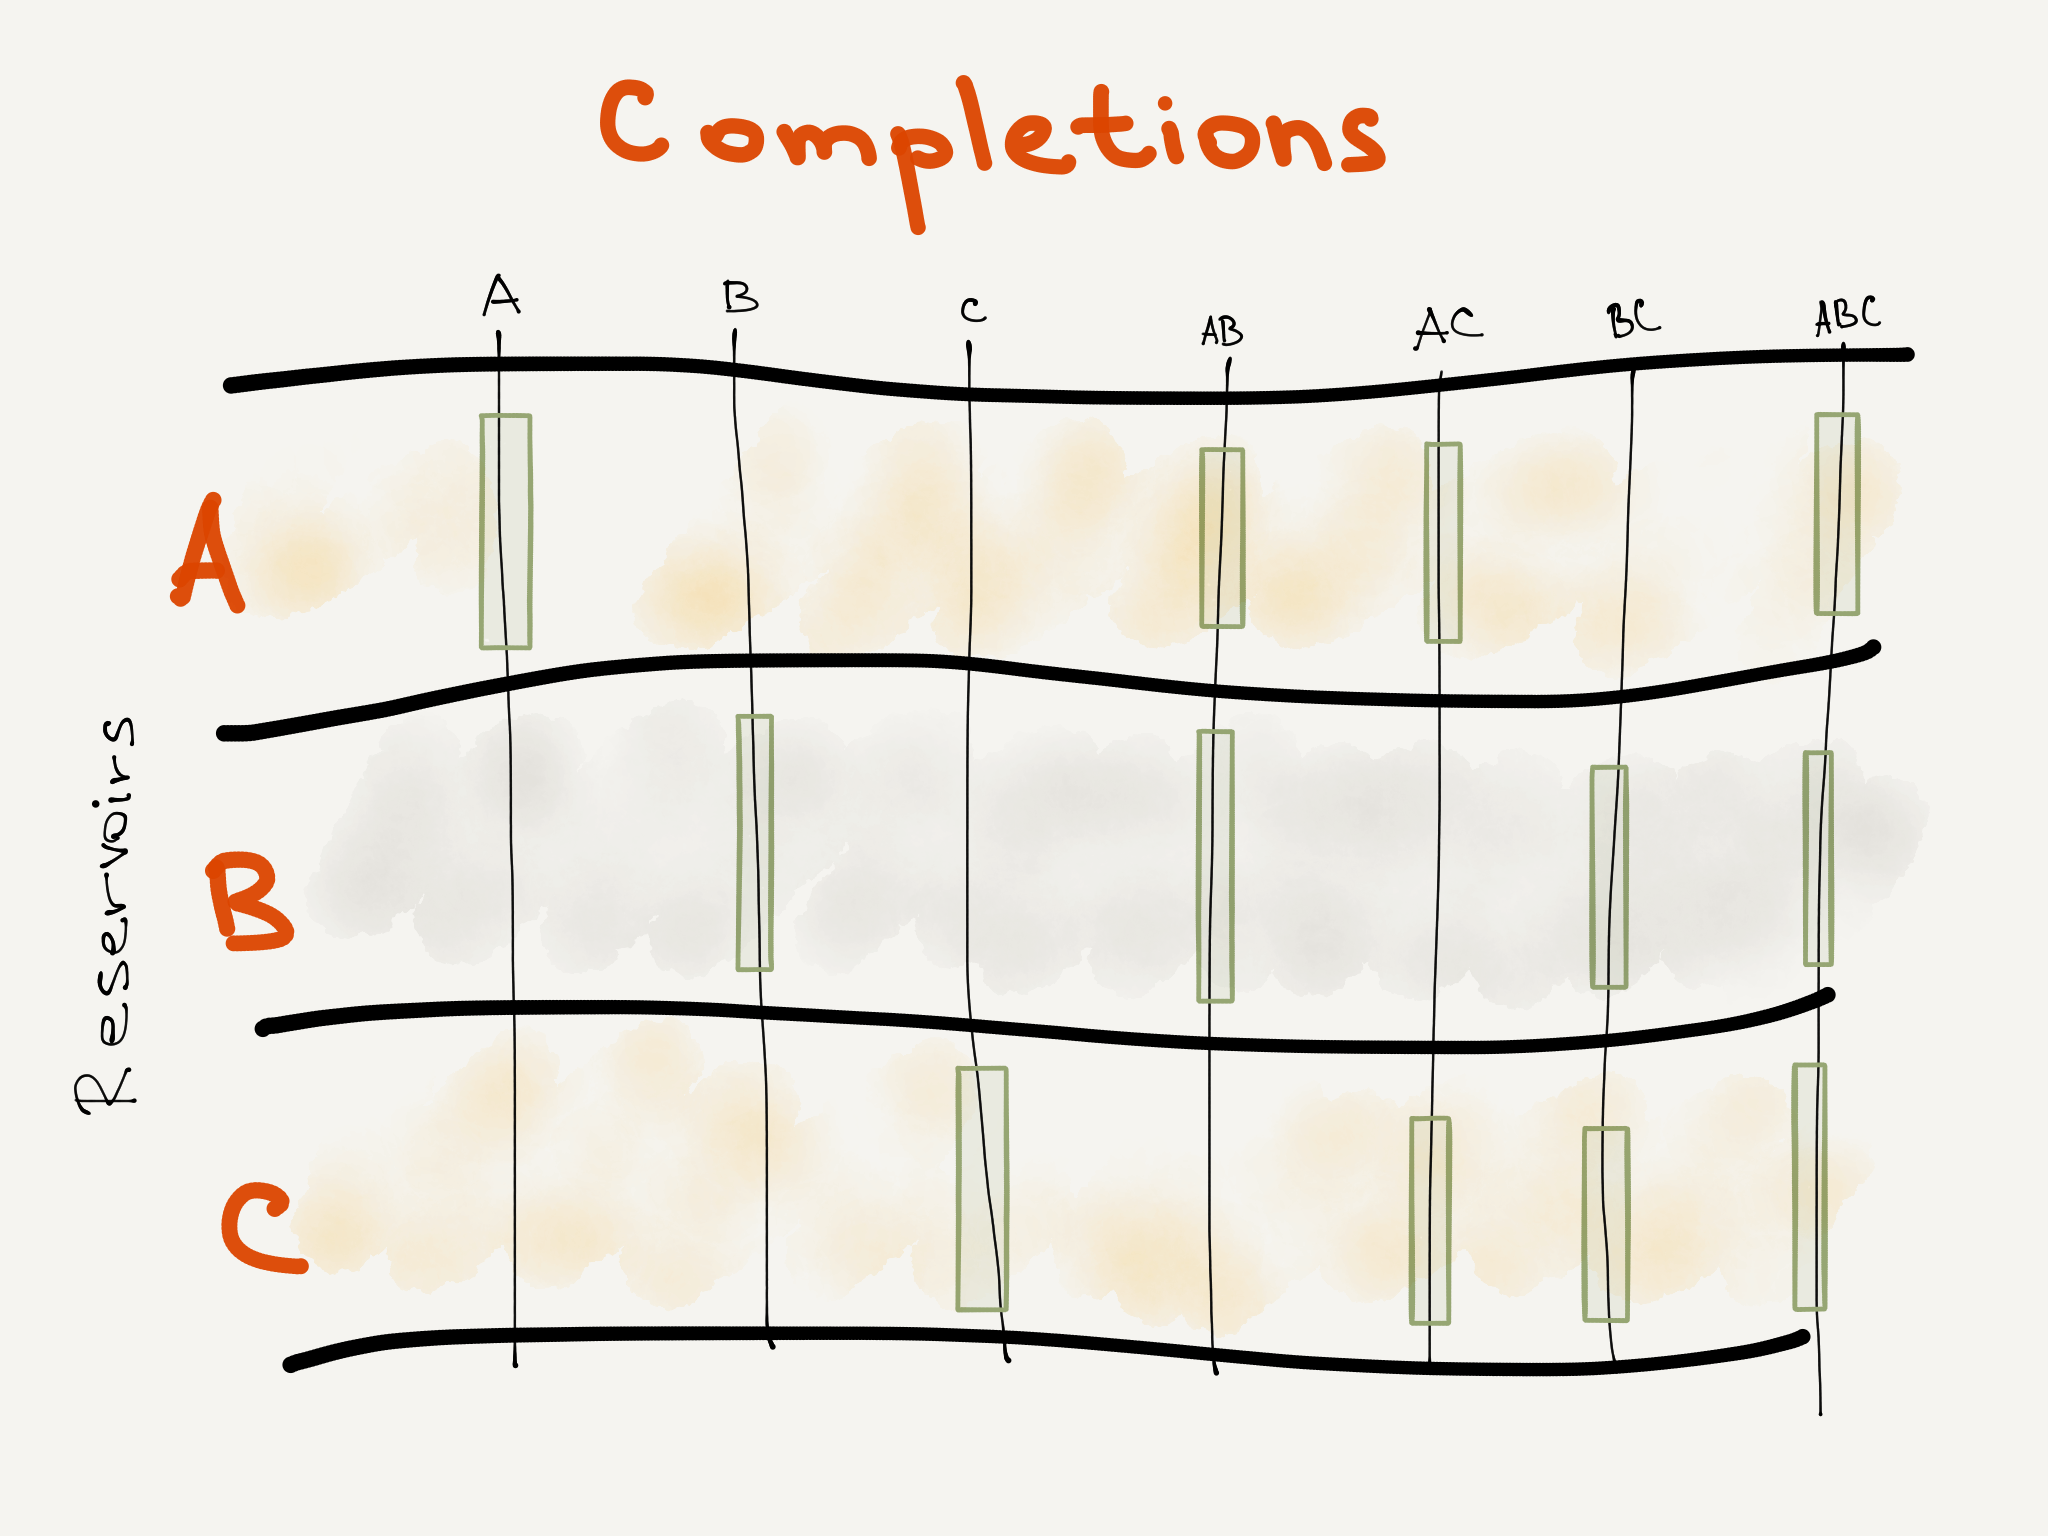
| 16:15, 6 March 2017 | Completion.png (file) |  |
940 KB | Completion examples | 2 |
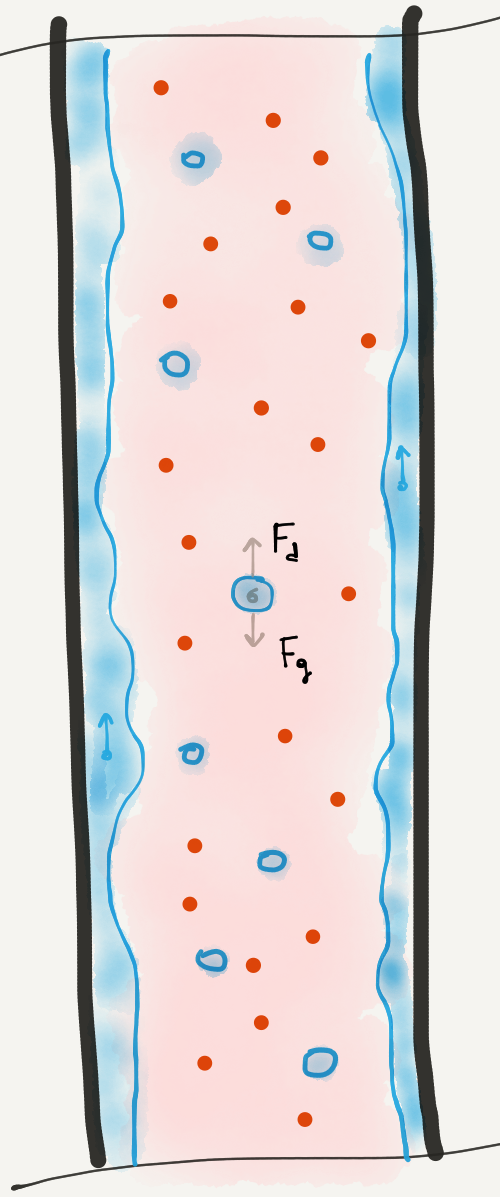
| 09:12, 16 March 2017 | Liquid Loading.png (file) |  |
289 KB | 1 | |
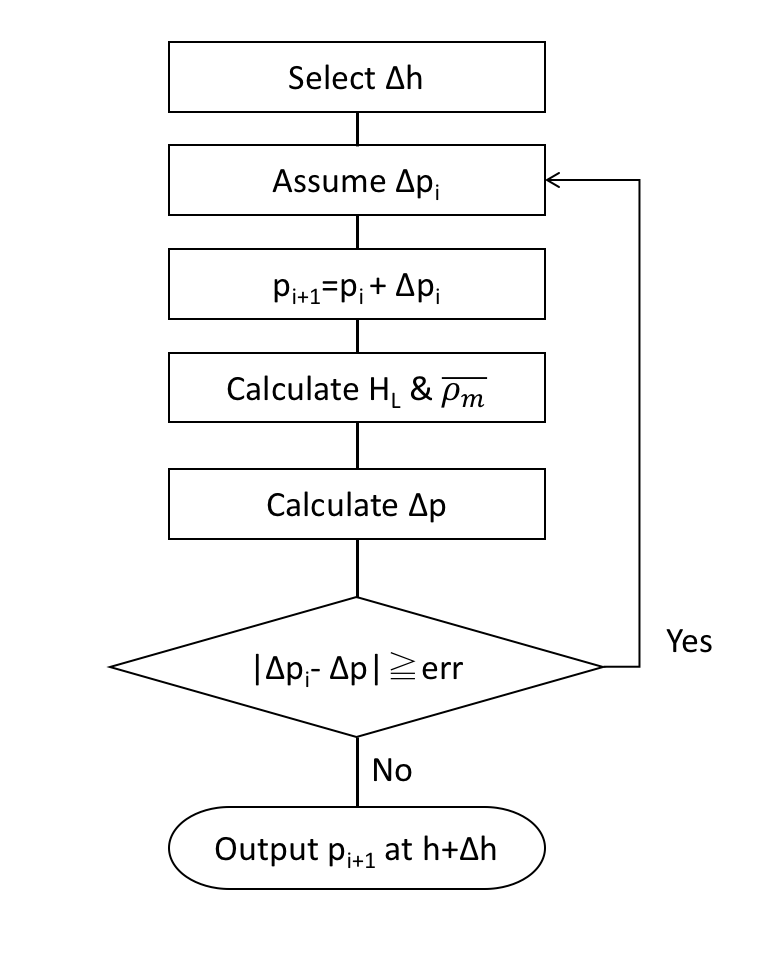
| 17:07, 22 March 2017 | HB Block Diagram.png (file) |  |
40 KB | Block diagram for the Hagedorn and Brown correlation | 1 |
| 09:51, 3 May 2017 | LeeSample.png (file) |  |
26 KB | sample 1&3 T=340F | 1 |
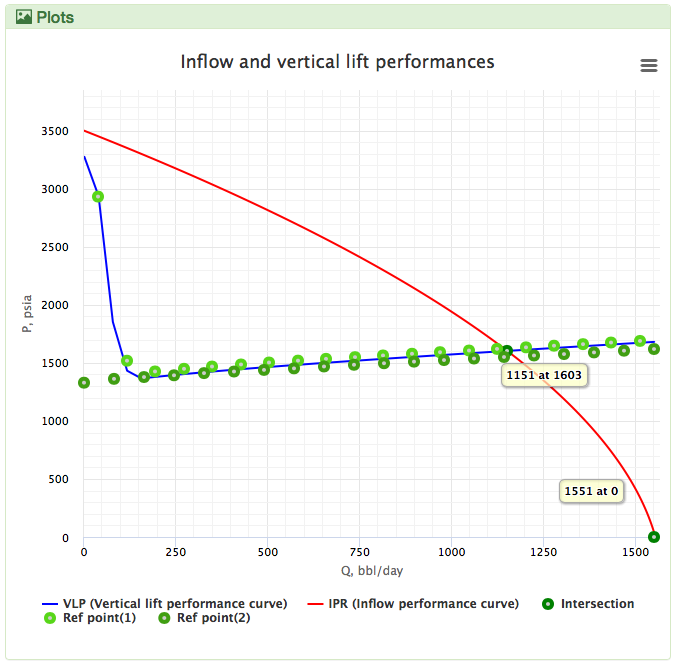
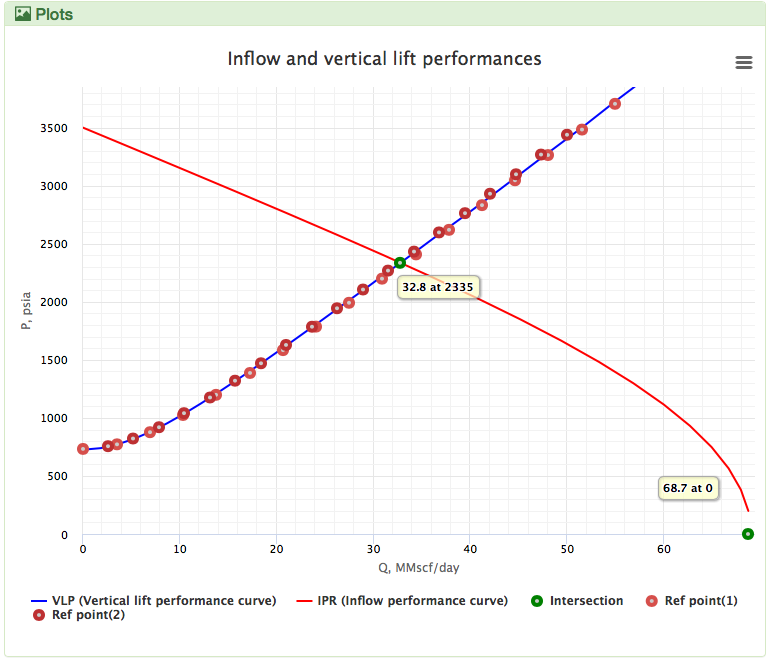
| 11:26, 18 May 2017 | Hagedorn and Brown.png (file) |  |
48 KB | VLP curve for live oil by pengtools PQplot using Hagedorn and Brown correlation Vs Proper and Kappa | 1 |
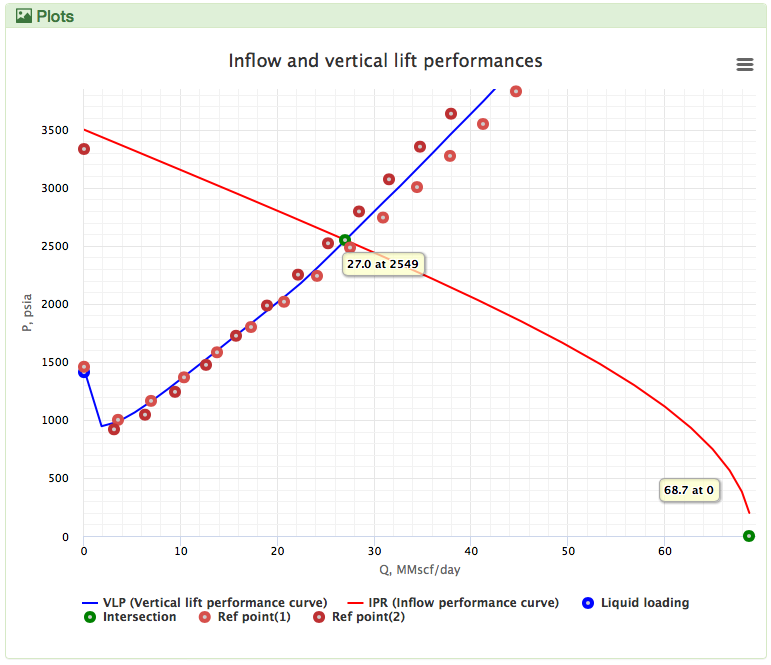
| 11:34, 18 May 2017 | GRAY.png (file) |  |
51 KB | VLP curve for wet gas by pengtools PQplot using Gray correlation Vs Proper and Kappa | 1 |
| 11:36, 18 May 2017 | Fanning.png (file) |  |
49 KB | VLP curve for dry gas by pengtools PQplot using Fanning correlation Vs Proper and Kappa | 1 |
| 12:56, 1 June 2017 | Beggs and Brill.png (file) |  |
44 KB | Comparison sPipe vs Beggs and Brill for Water | 1 |
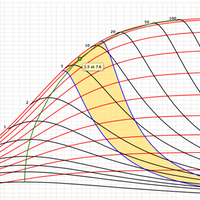
| 15:42, 30 June 2017 | OptiFrac i.png (file) |  |
63 KB | optiFrac logo | 1 |
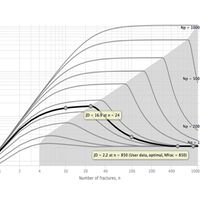
| 15:59, 30 June 2017 | OptiFracMS i.png (file) |  |
31 KB | 1 | |
| 16:27, 28 July 2017 | Petroleum Engineering Timeline.png (file) |  |
496 KB | Petroleum Engineering Timeline v5 | 3 |
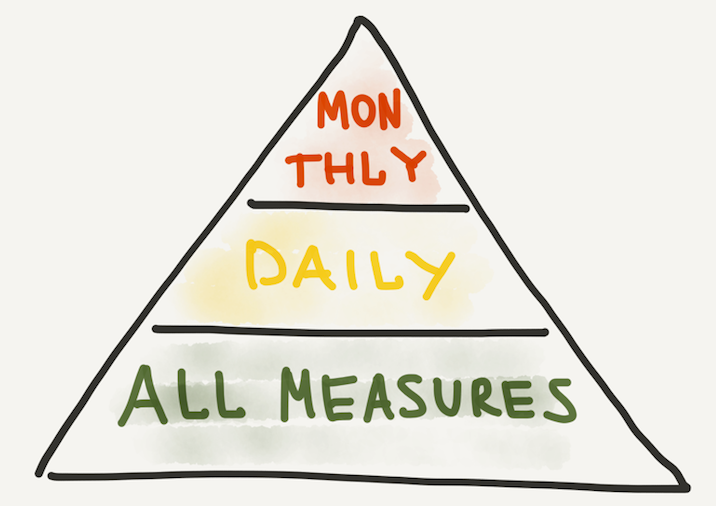
| 17:54, 27 October 2017 | Measures Structure.png (file) |  |
173 KB | Drawing shows E&P Portal data structure | 1 |
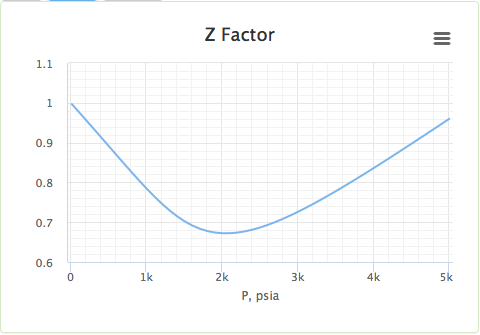
| 12:08, 20 November 2017 | Zfactor.png (file) |  |
12 KB | z factor example Dranchuk correlation | 1 |
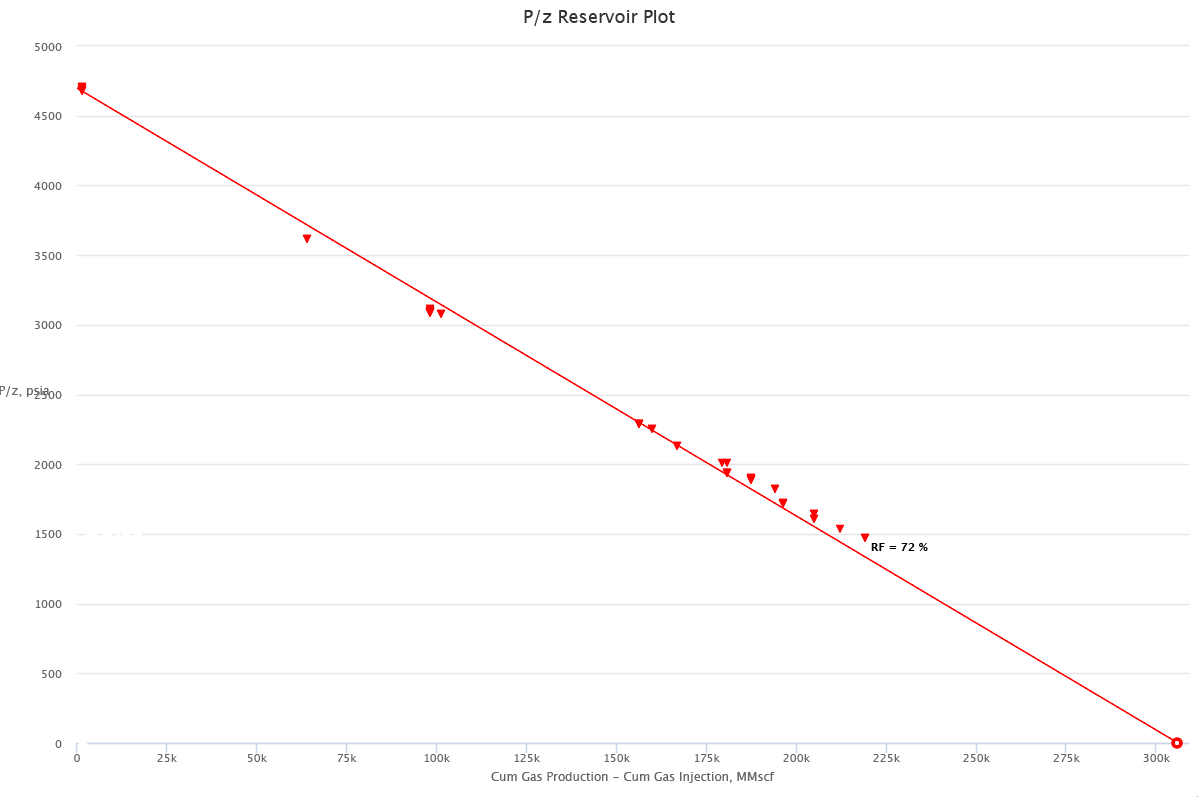
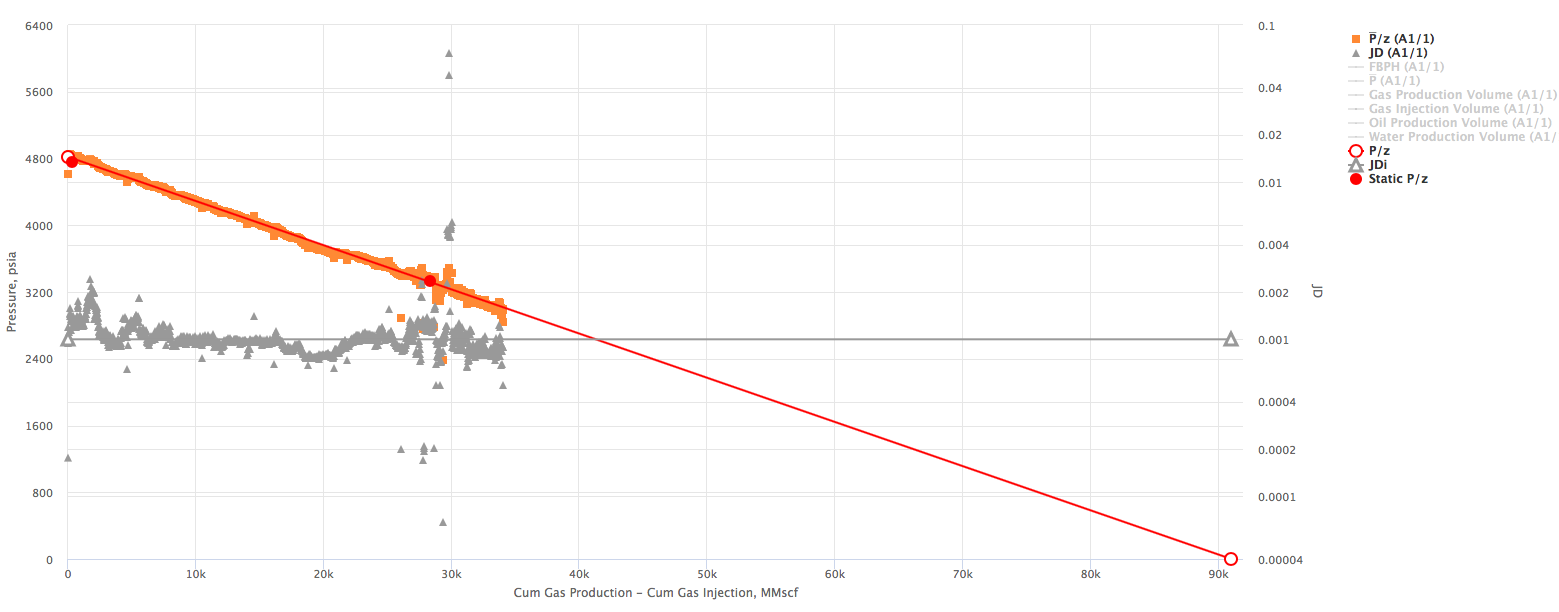
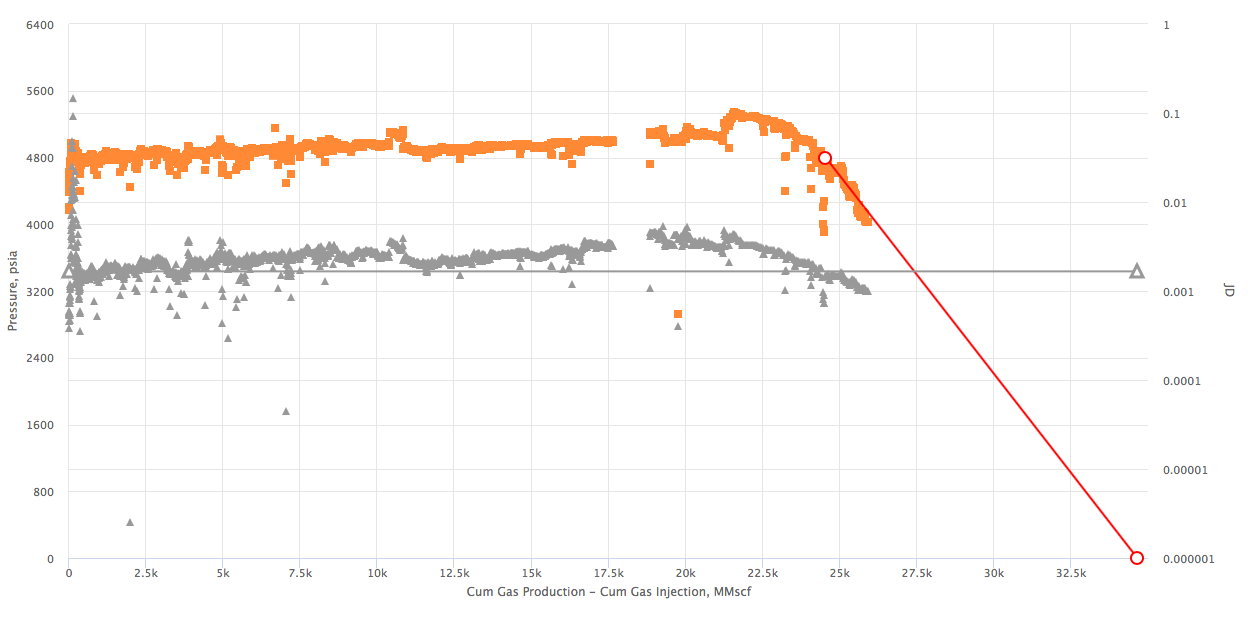
| 11:39, 21 November 2017 | PoverZ.png (file) |  |
21 KB | P/Z plot example | 1 |
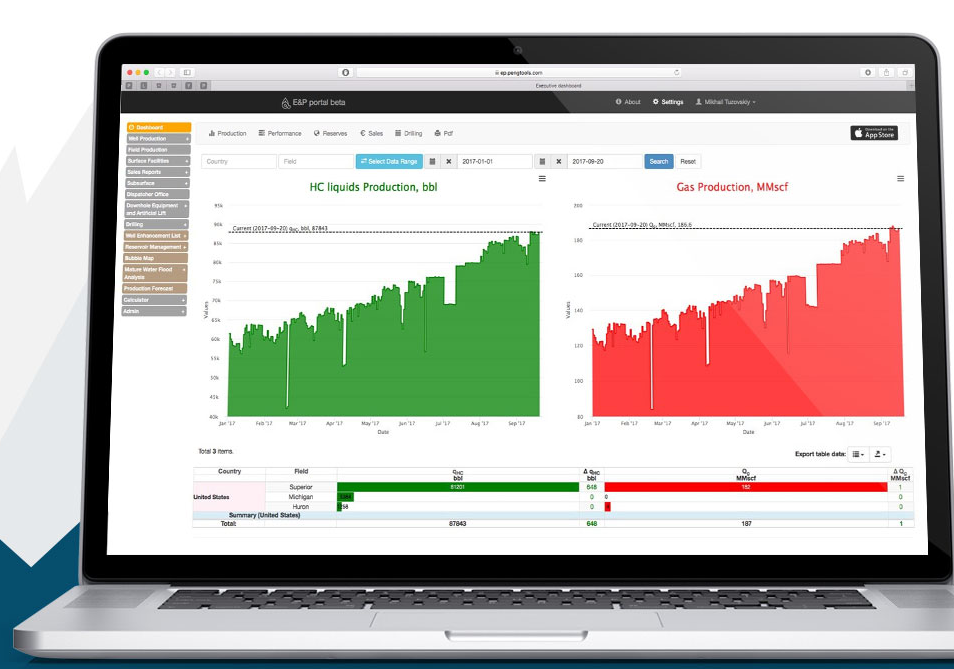
| 08:58, 6 December 2017 | EPPortal.png (file) |  |
284 KB | E&P Portal | 1 |
| 09:12, 6 December 2017 | DCA.gif (file) |  |
174 KB | Decline Curve Analysis | 1 |
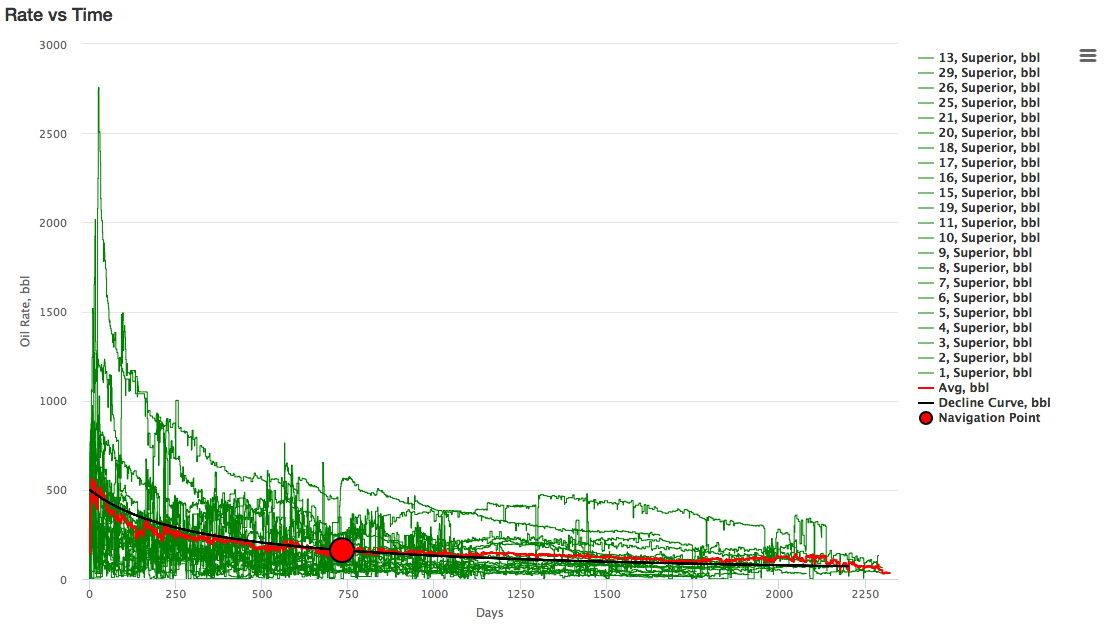
| 09:21, 6 December 2017 | DCA for multiple wells.png (file) |  |
96 KB | Decline Curve Analysis applied to multiple wells | 1 |
| 08:39, 12 December 2017 | FMB.png (file) |  |
59 KB | Flowing Material Balance | 1 |
| 09:15, 12 December 2017 | FMBex1.png (file) |  |
66 KB | Flowing Material Balance example 1 | 1 |
| 09:16, 12 December 2017 | FMBex2.png (file) |  |
75 KB | Flowing Material Balance Example 2 | 1 |
| 09:29, 12 December 2017 | FMBex3.png (file) |  |
42 KB | Flowing Material Balance Example 3 | 1 |
| 12:42, 12 December 2017 | UploadDailyMeasuresMETRIC.csv (file) | 680 bytes | Daily Measures upload example template METRIC | 1 | |
| 12:42, 12 December 2017 | UploadDailyMeasuresFIELD.csv (file) | 686 bytes | Daily Measures upload example template FIELD | 1 | |
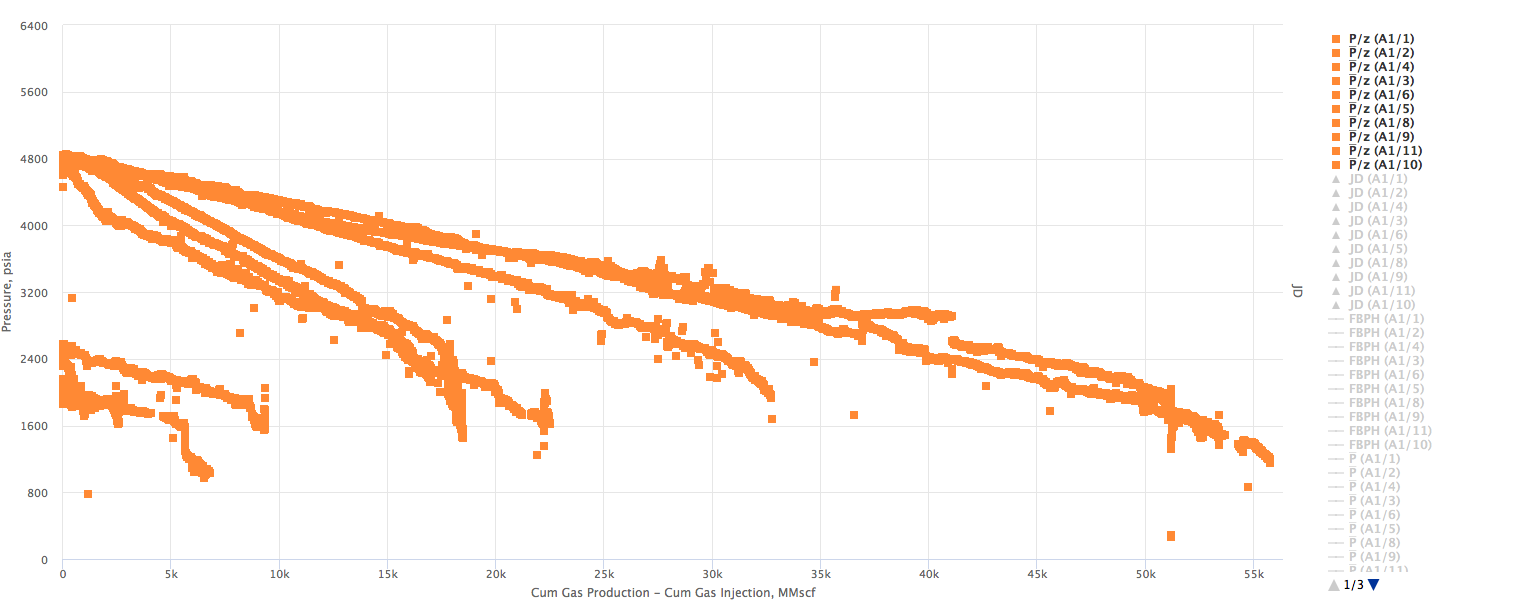
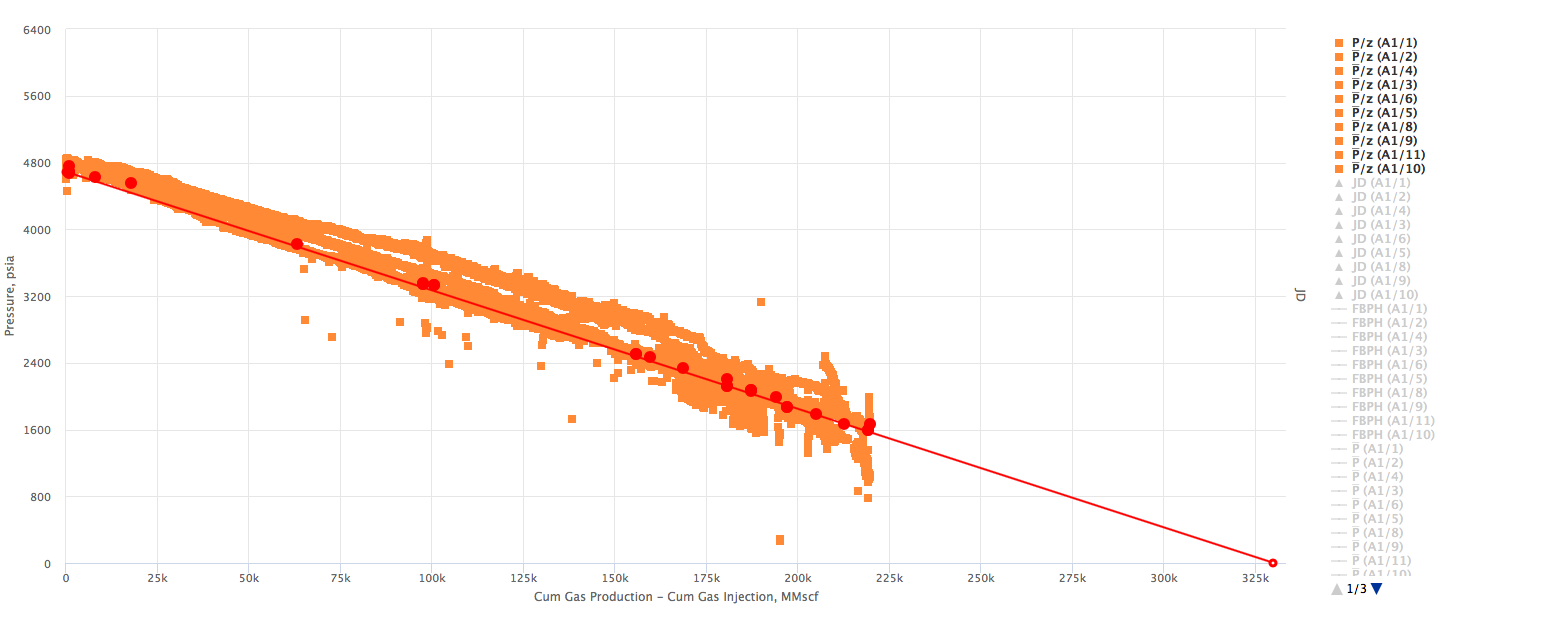
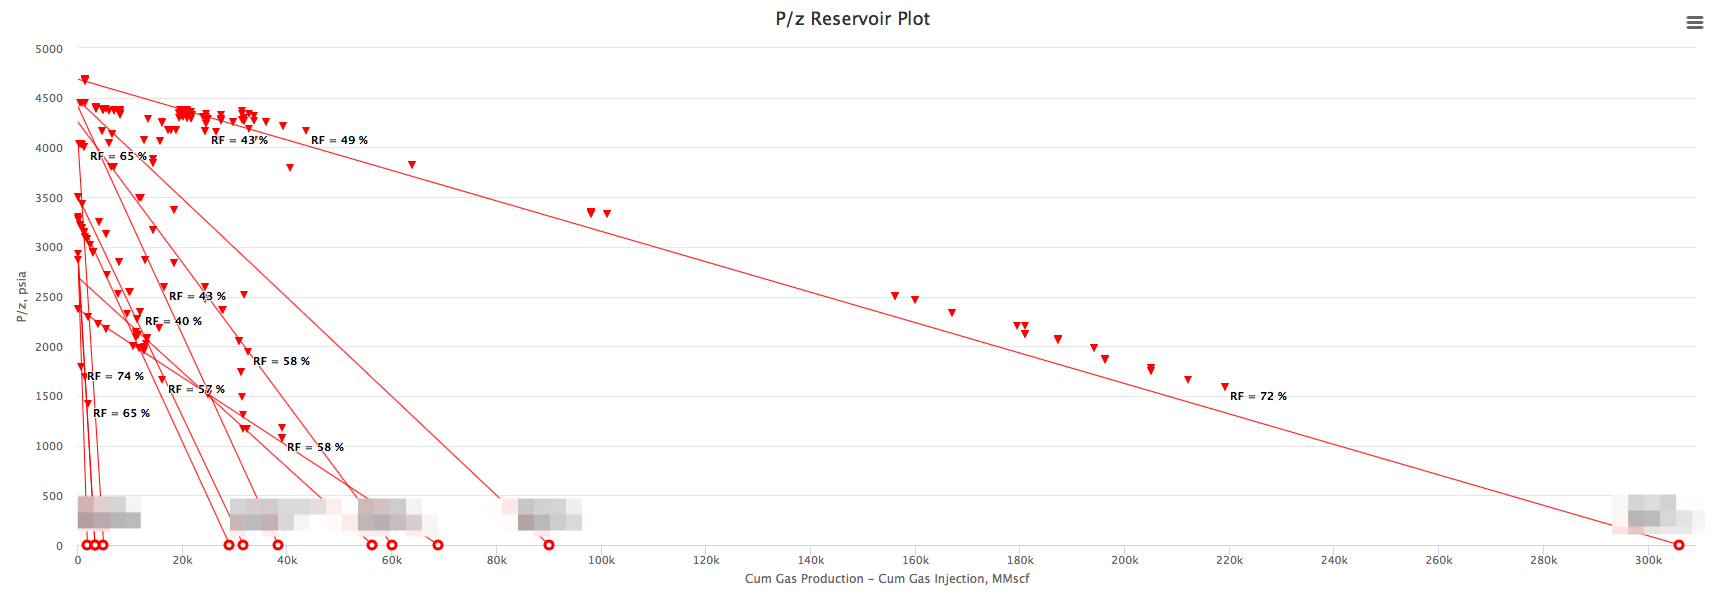
| 12:47, 13 December 2017 | Poverz multiple reservoirs.png (file) |  |
66 KB | P/z plot for multiple Reservoirs | 1 |
| 09:27, 15 December 2017 | UploadWells.csv (file) | 710 bytes | Upload Wells Example Template | 1 | |
| 12:38, 26 December 2017 | Subsurface.png (file) |  |
49 KB | E&P Portal Subsurface Module Logo | 1 |
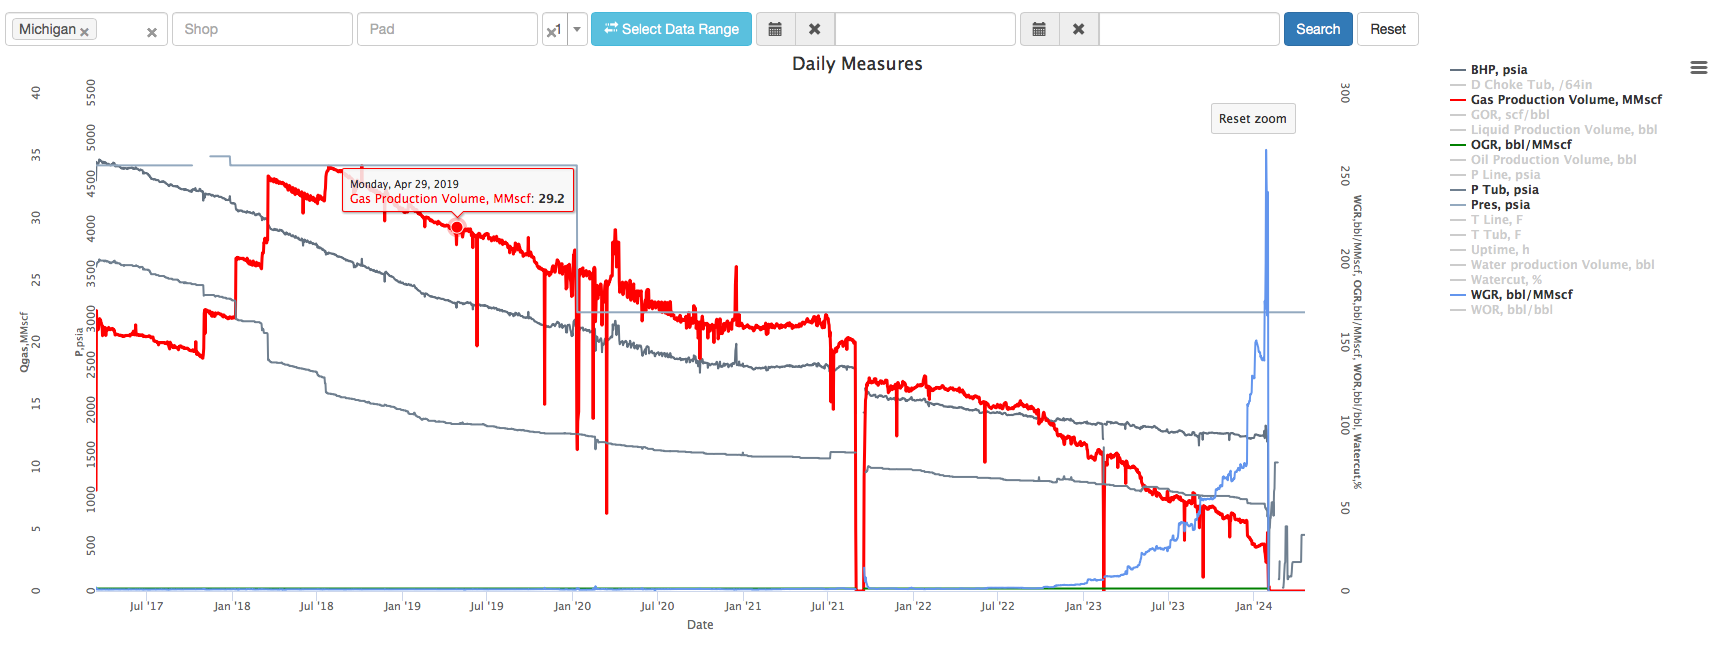
| 12:49, 26 December 2017 | WellTrends.png (file) |  |
121 KB | well trends example daily measures | 1 |
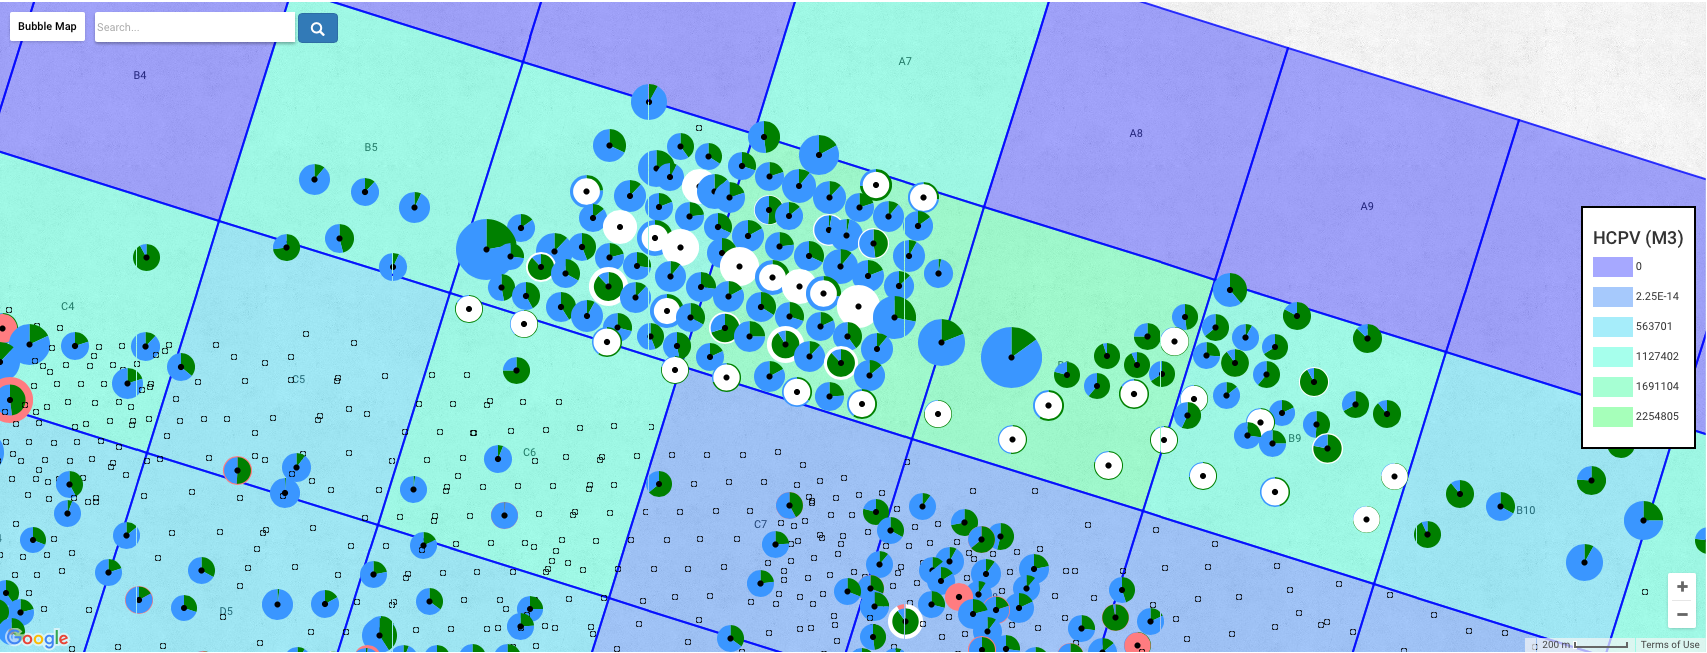
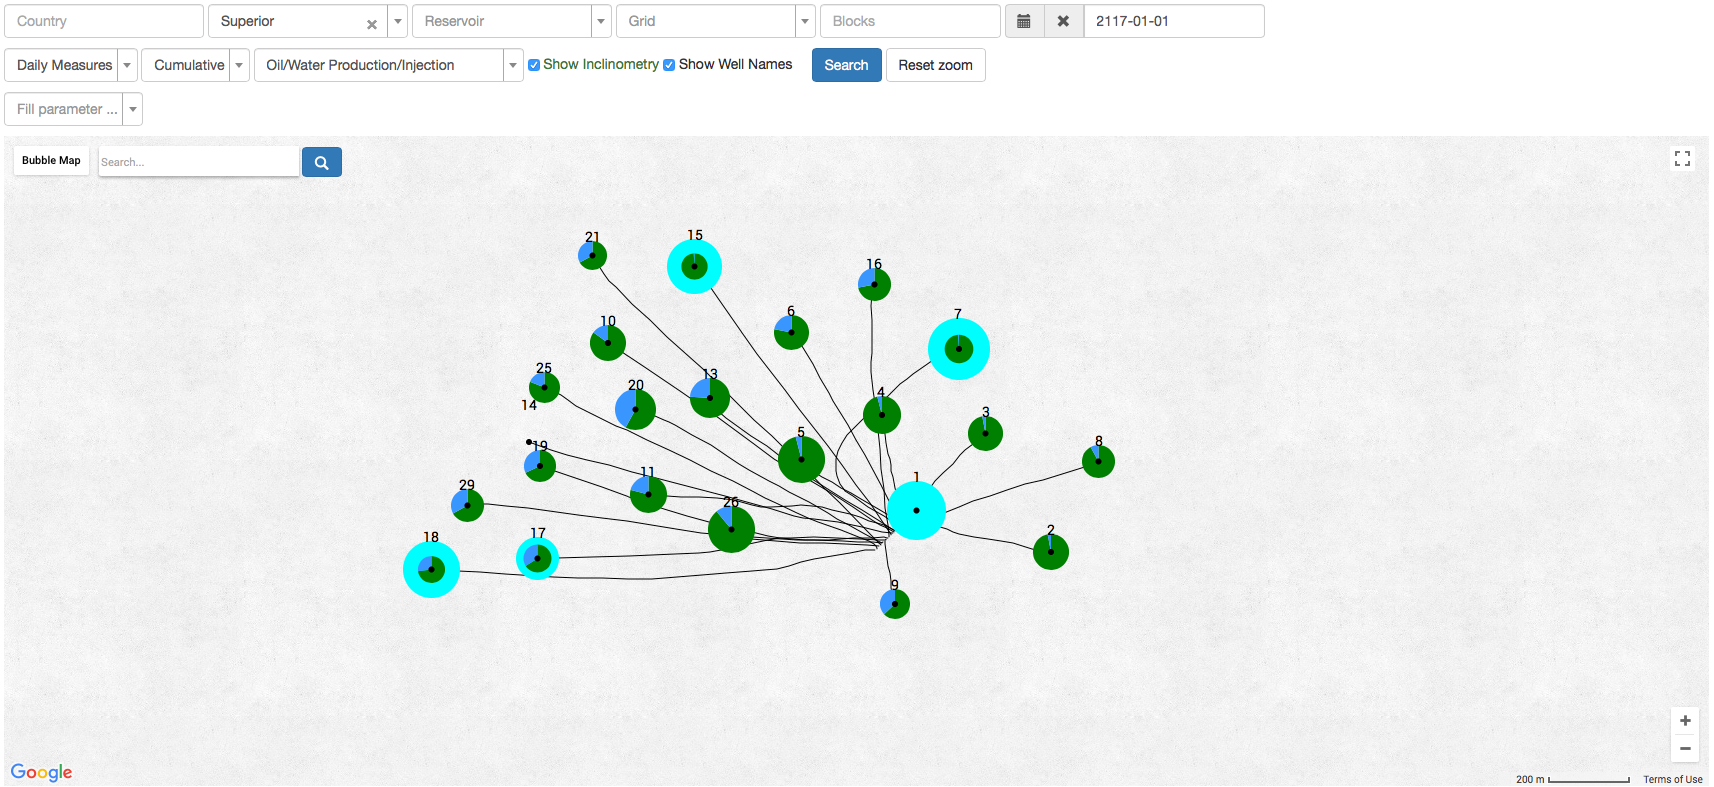
| 12:25, 27 December 2017 | BubbleMap.png (file) |  |
273 KB | Bubble map example | 1 |
| 13:19, 18 April 2018 | OilFMB CaseStudy.pdf (file) | 7.96 MB | Oil FMB case study | 1 | |
| 13:24, 18 April 2018 | Well 8 daily data.csv (file) | 192 KB | 1 | ||
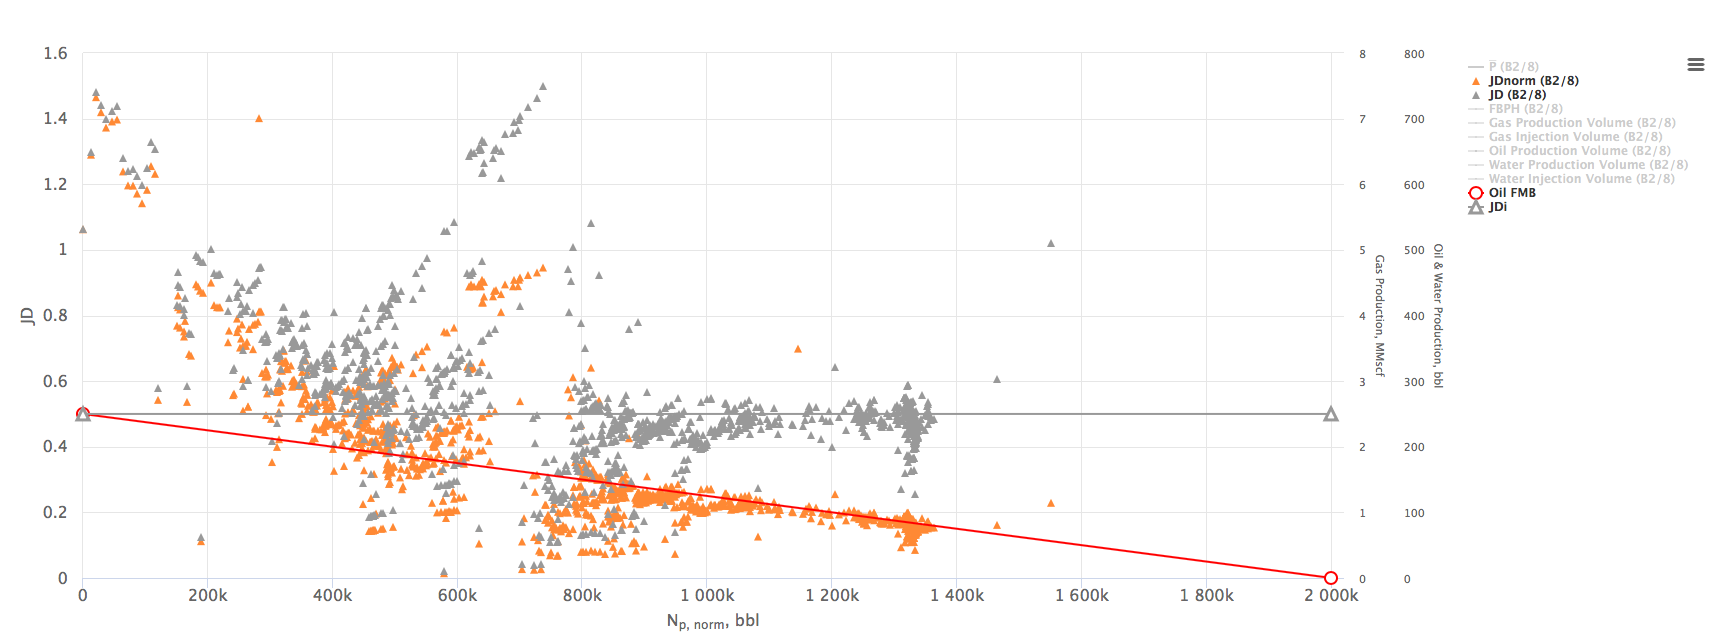
| 08:30, 20 April 2018 | OilFMB Case Study.png (file) |  |
132 KB | Oil Flowing Material Balance Case Study | 1 |
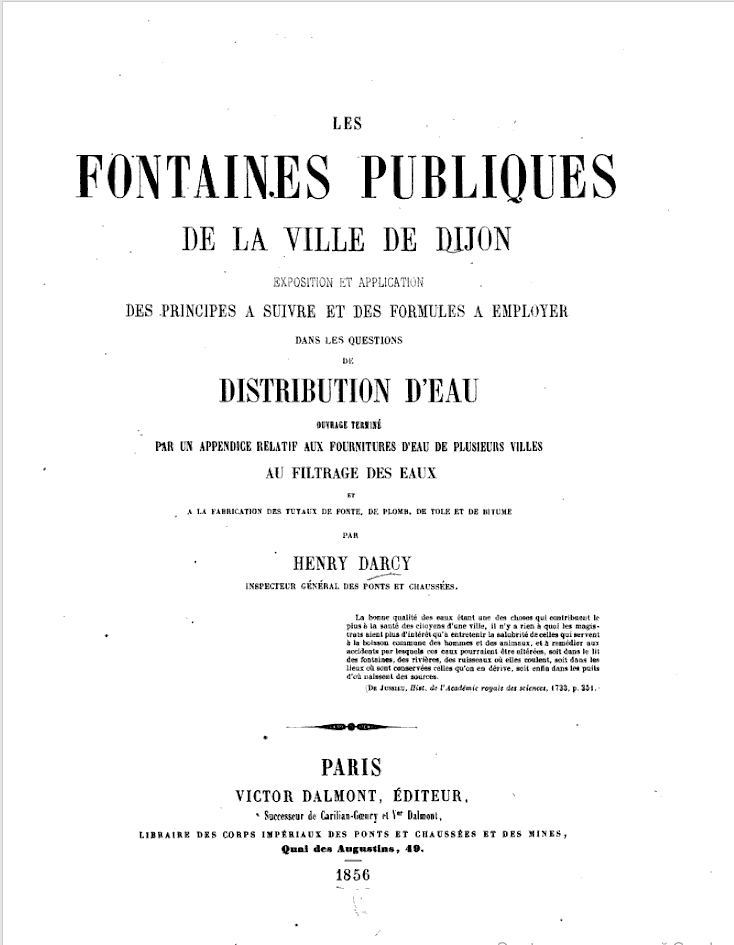
| 06:34, 23 April 2018 | Les Fontaines Publiques de la Ville de Dijon.png (file) |  |
40 KB | Darcy's Law original paper 1856 | 1 |
| 08:05, 23 April 2018 | OilFMB.png (file) |  |
98 KB | Oil FMB tool at the E&P Portal | 3 |
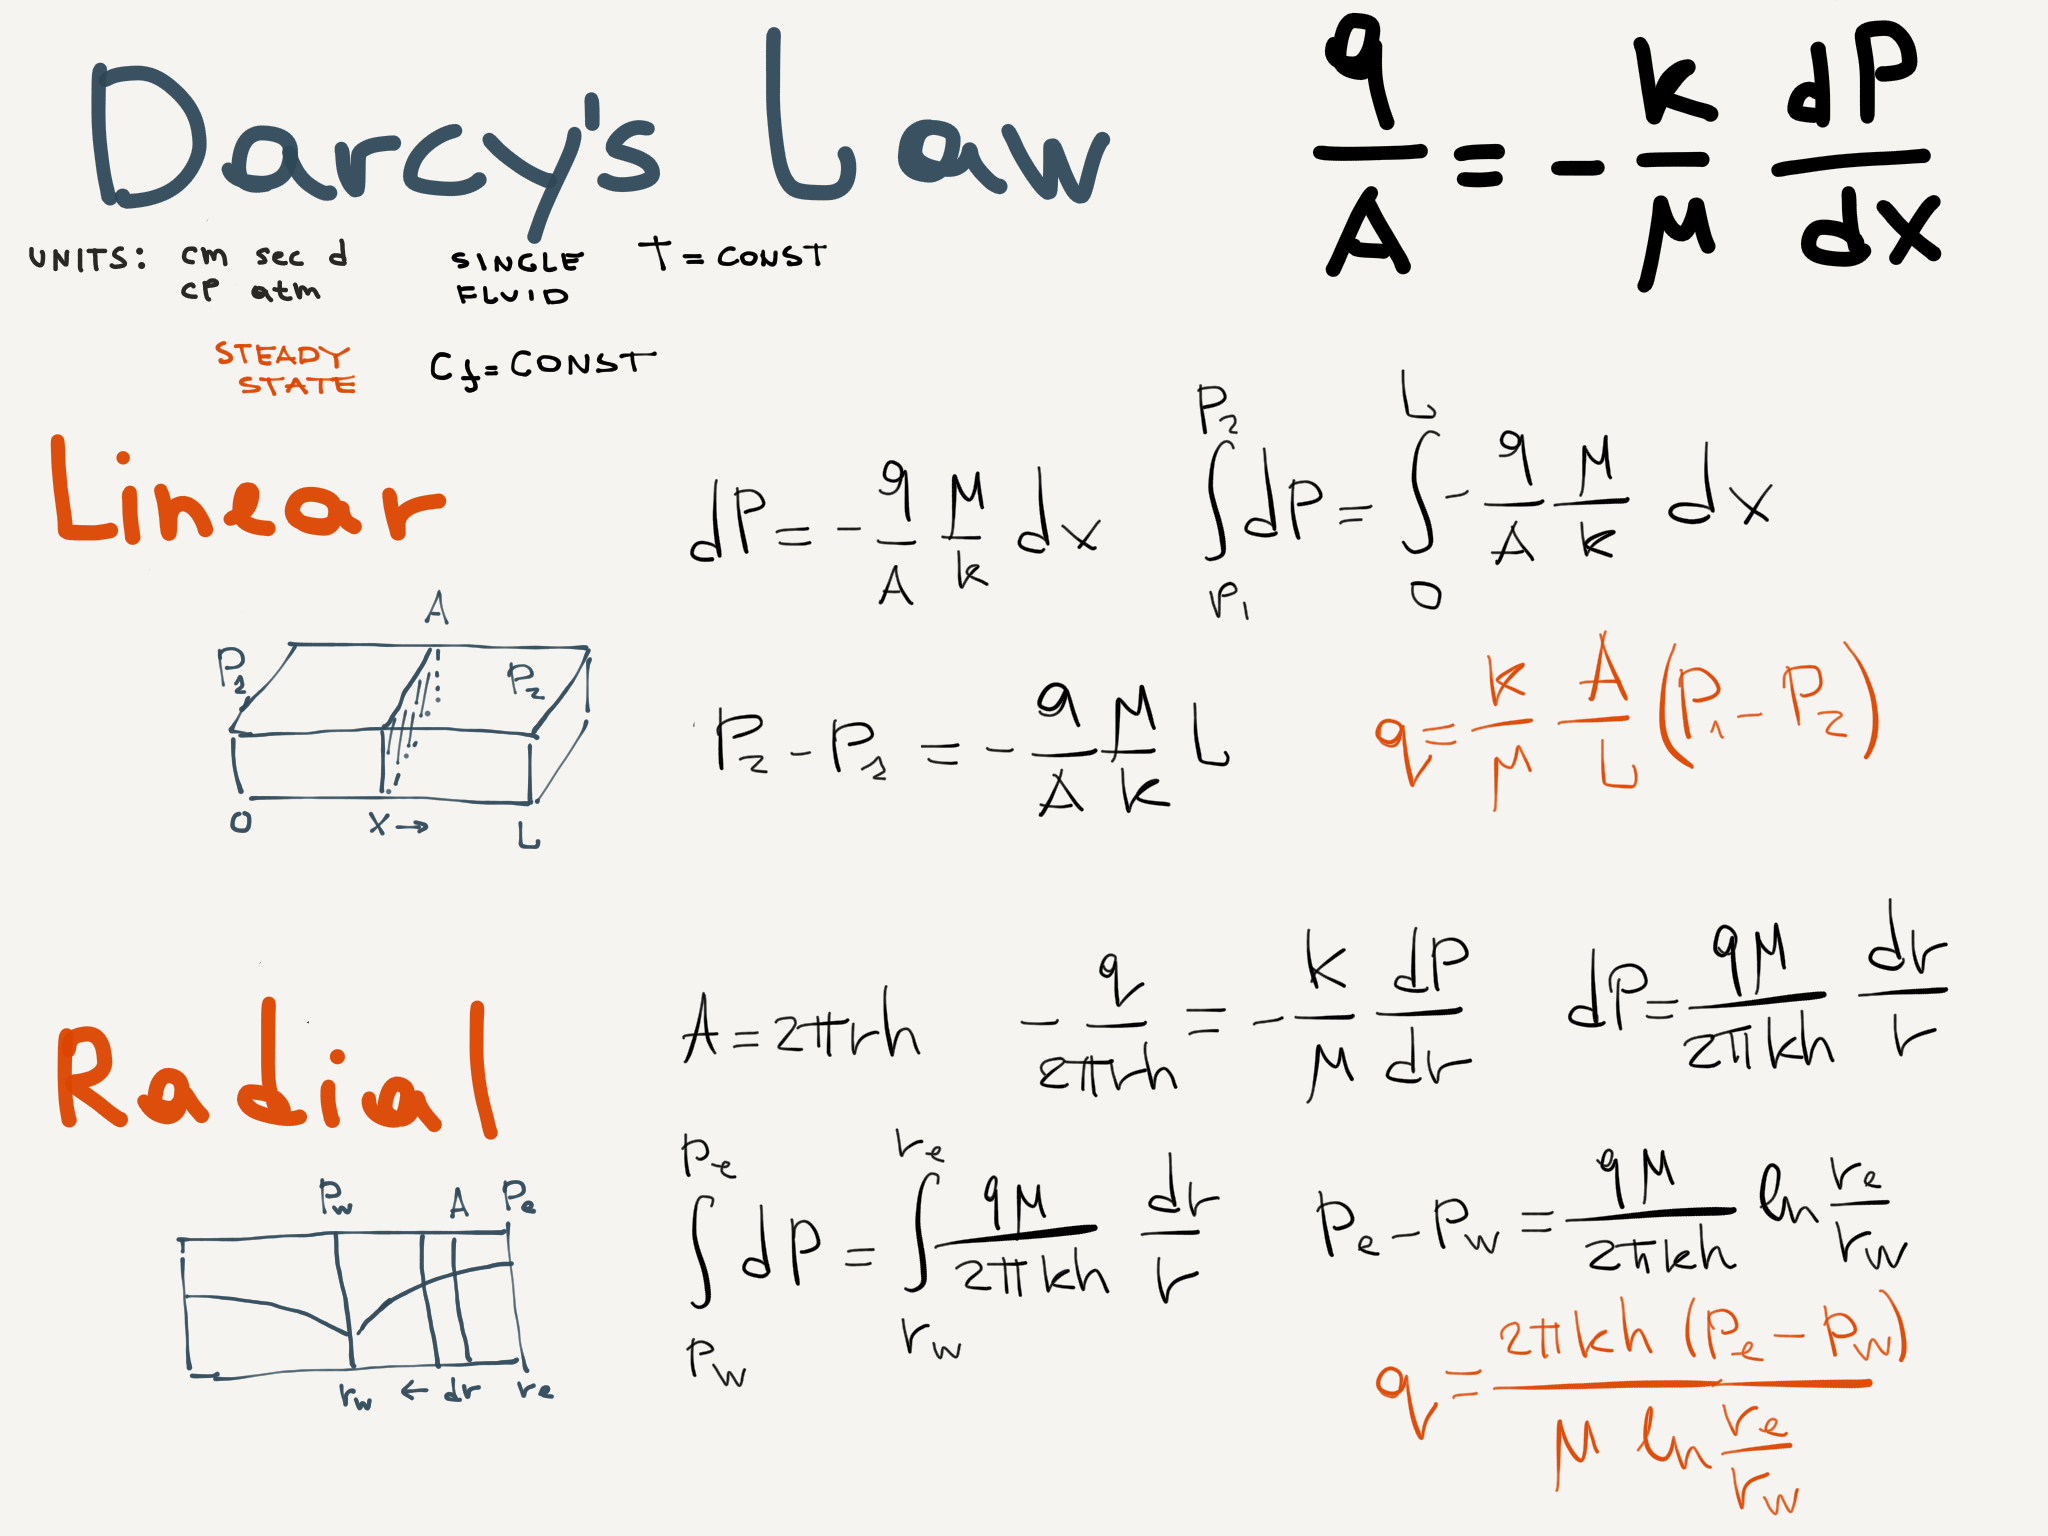
| 12:57, 23 April 2018 | Darcy's Law mtuz.png (file) |  |
420 KB | Darcy's Law Linear and Radial inflow equations | 1 |
| 13:20, 4 May 2018 | PumpDesign i.png (file) |  |
50 KB | Pump Design Logo | 1 |
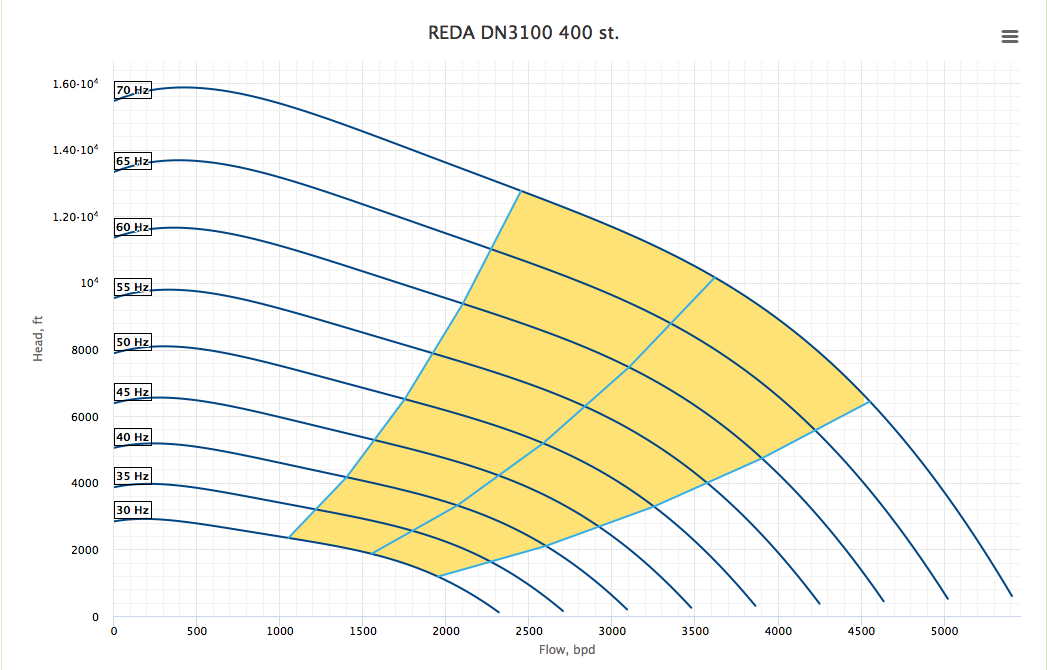
| 07:54, 10 May 2018 | Tornadochart.png (file) |  |
99 KB | Example of tornado chart for the REDA DN3100 pump at 400 stages | 1 |
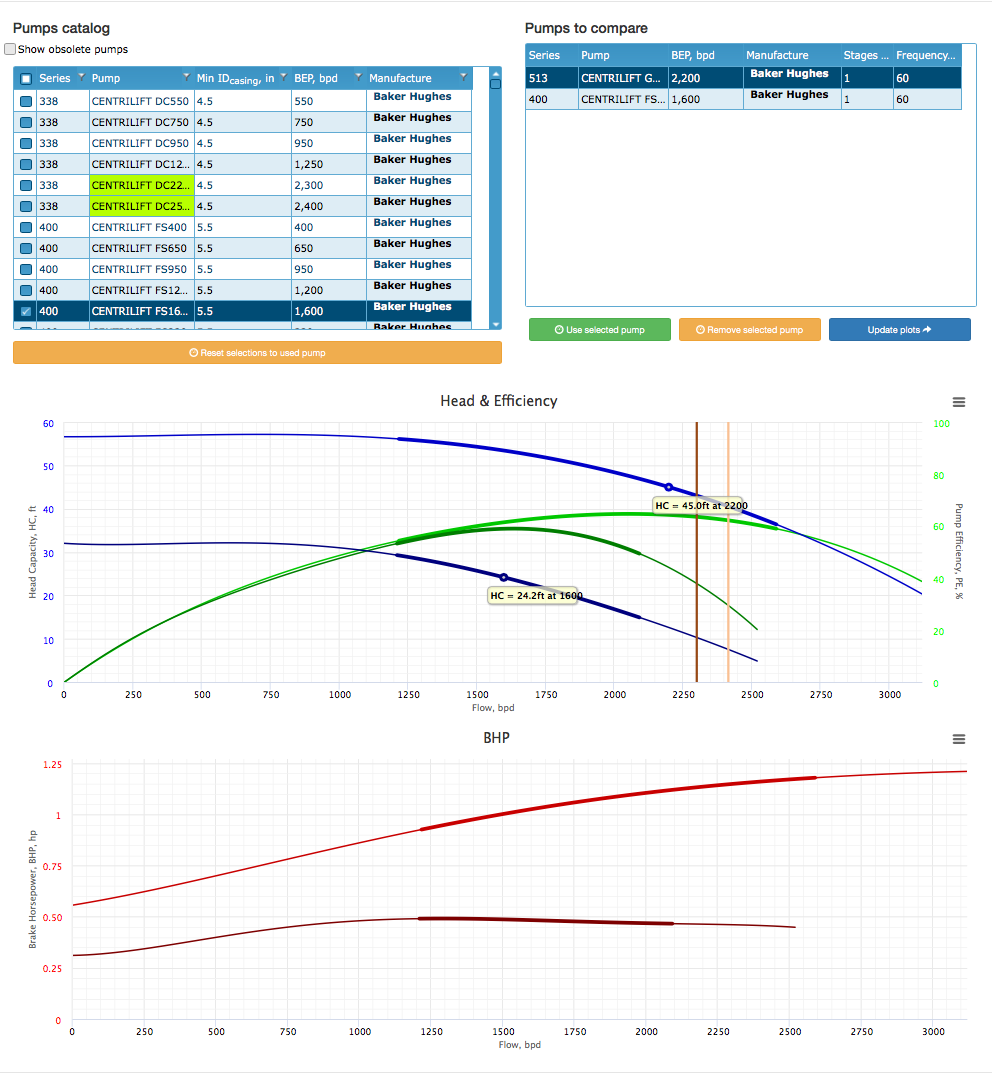
| 08:40, 10 May 2018 | ESPcatalog.png (file) |  |
139 KB | 1 | |
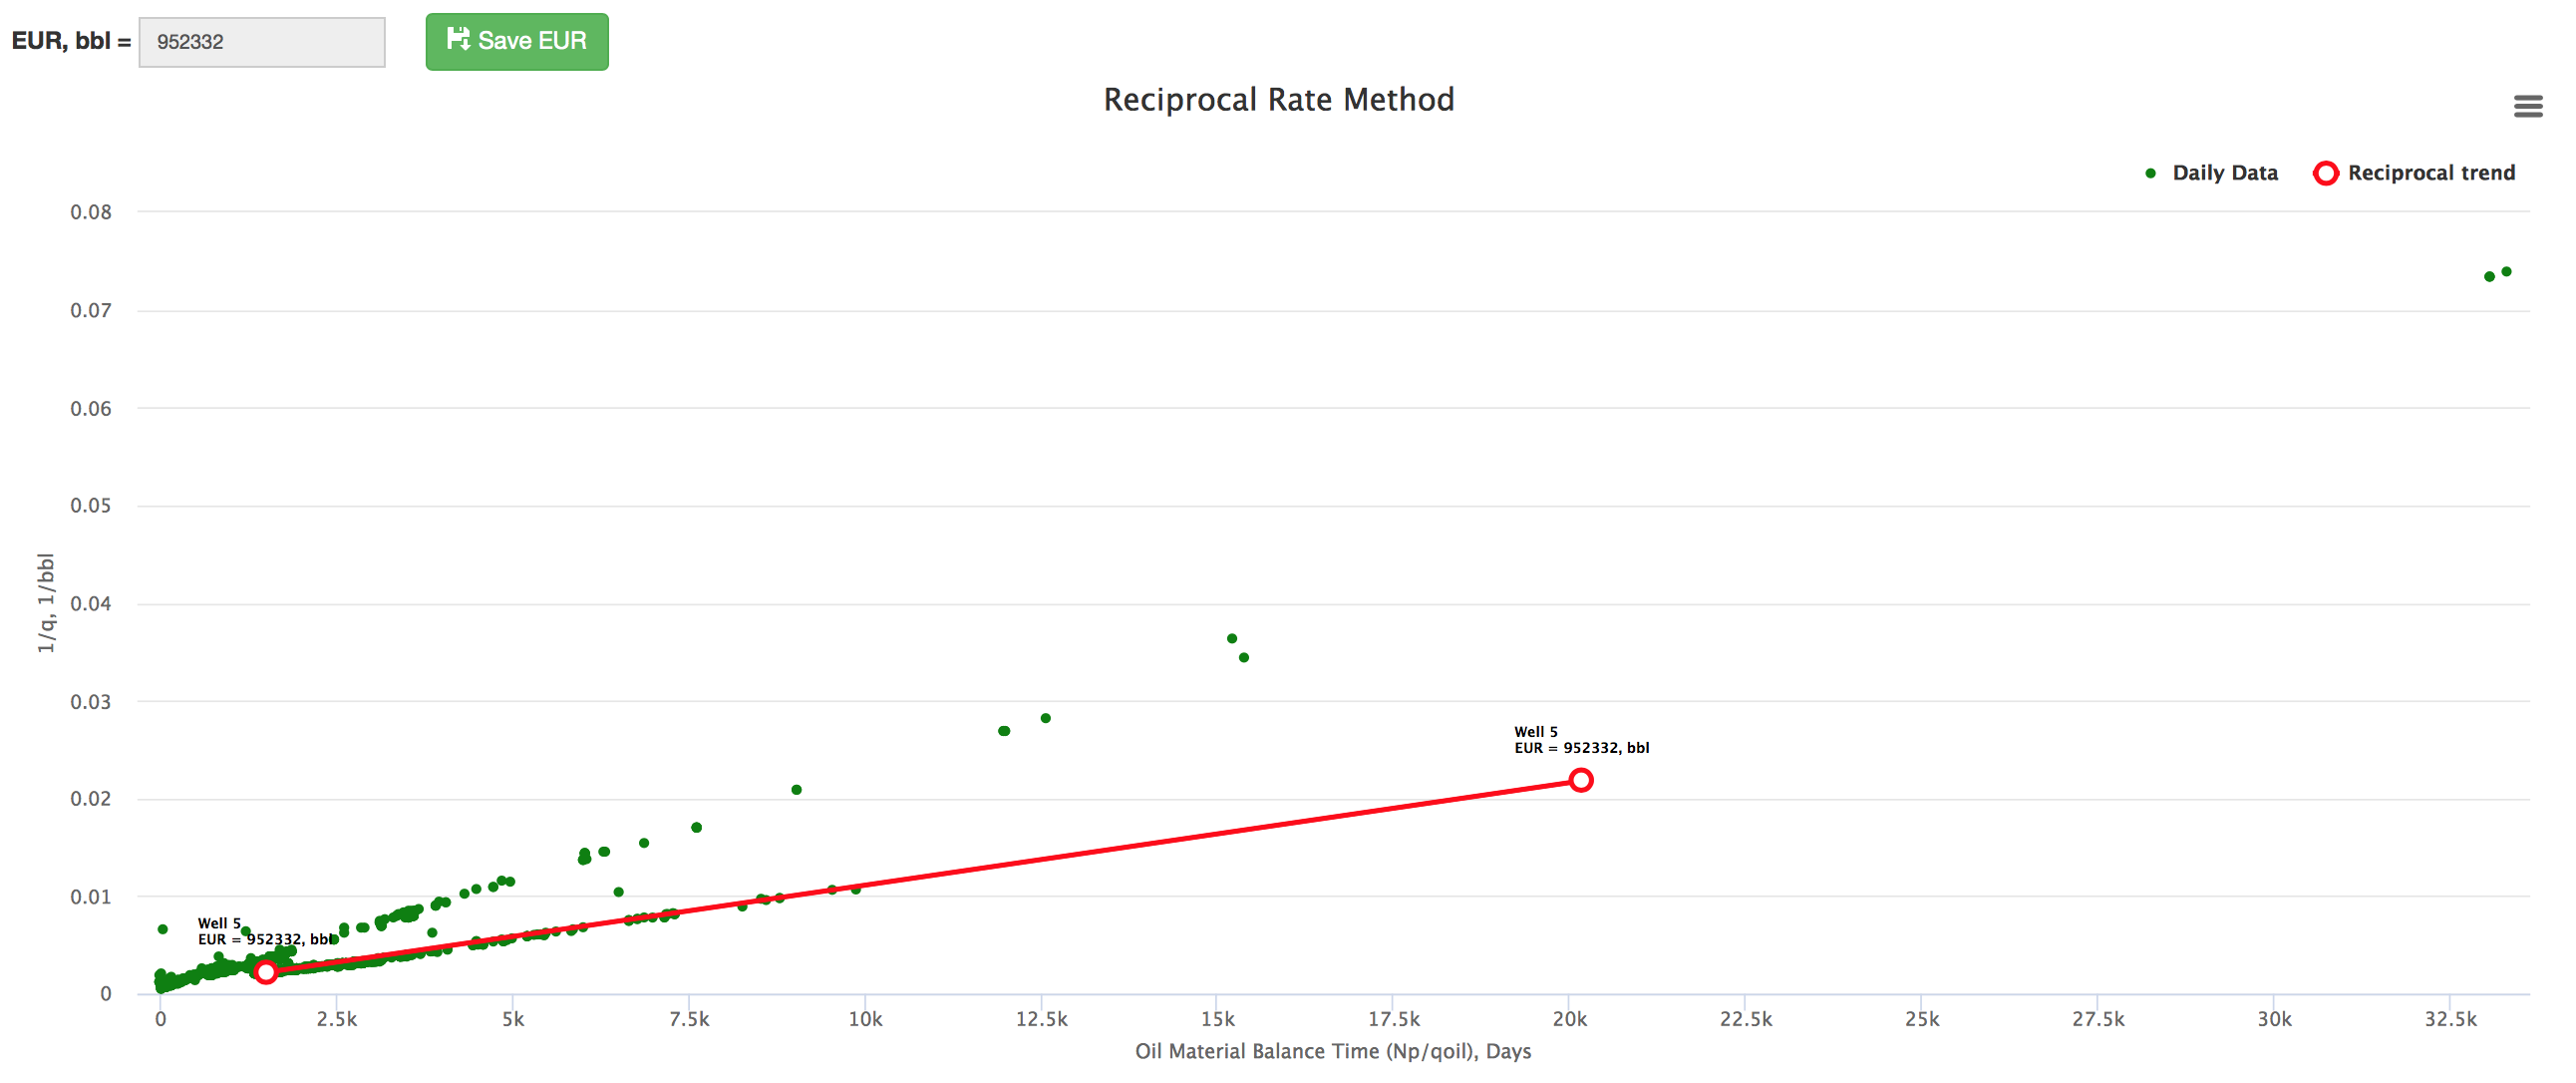
| 17:00, 28 May 2018 | ReciprocalRateMethod.png (file) |  |
71 KB | Reciprocal Rate Method on E&P Portal | 1 |
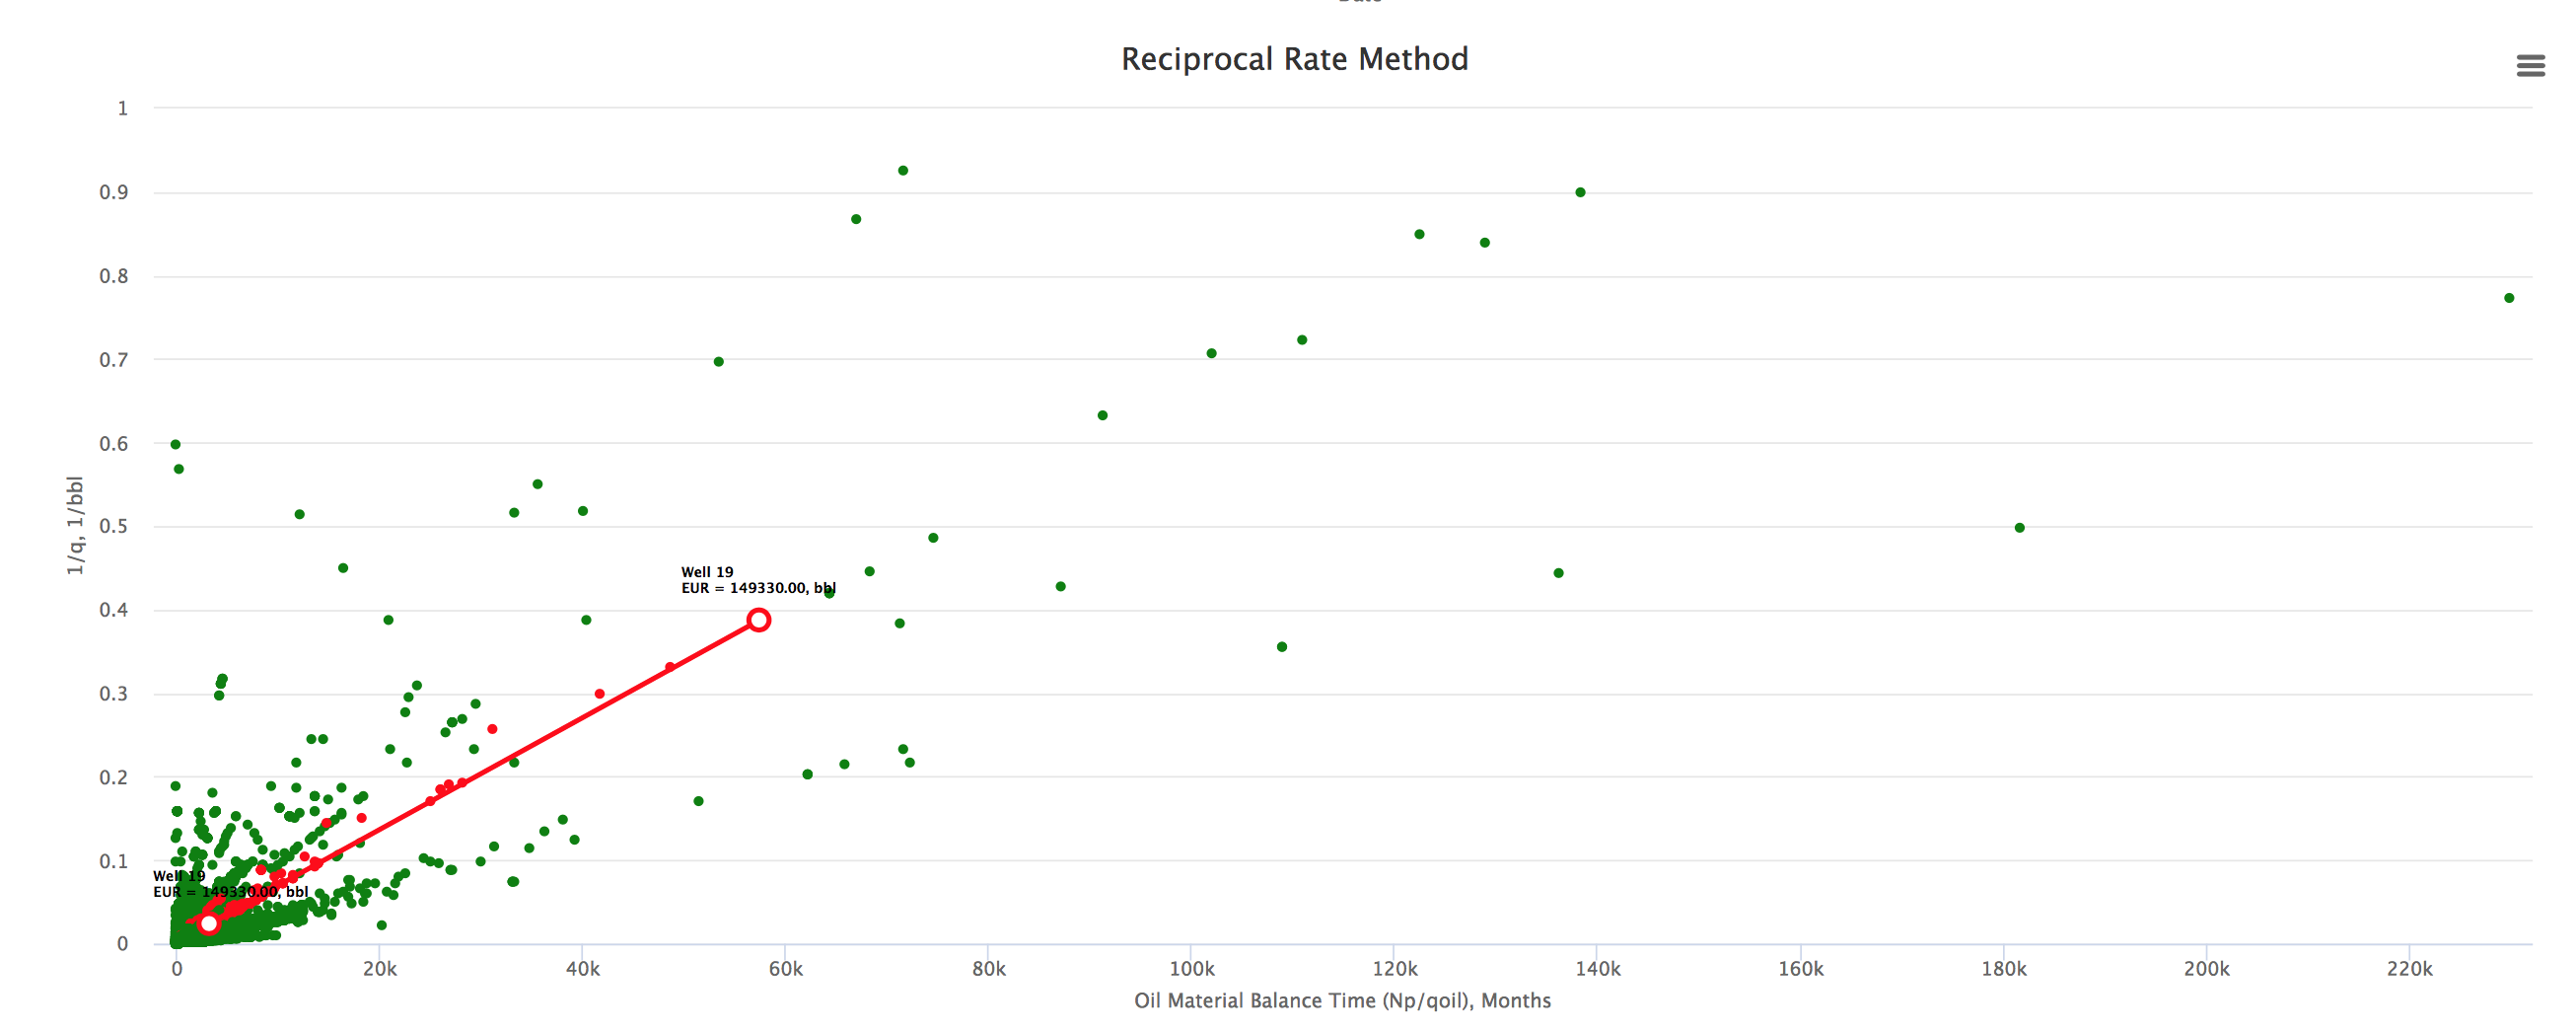
| 11:34, 29 May 2018 | Reciprocal Rate Method Example 1.png (file) |  |
72 KB | Reciprocal Rate Method Example 1 23 wells on the Reciprocal Rate Method plot showing the EUR data spread. Well 19 trend is highlighted. | 1 |
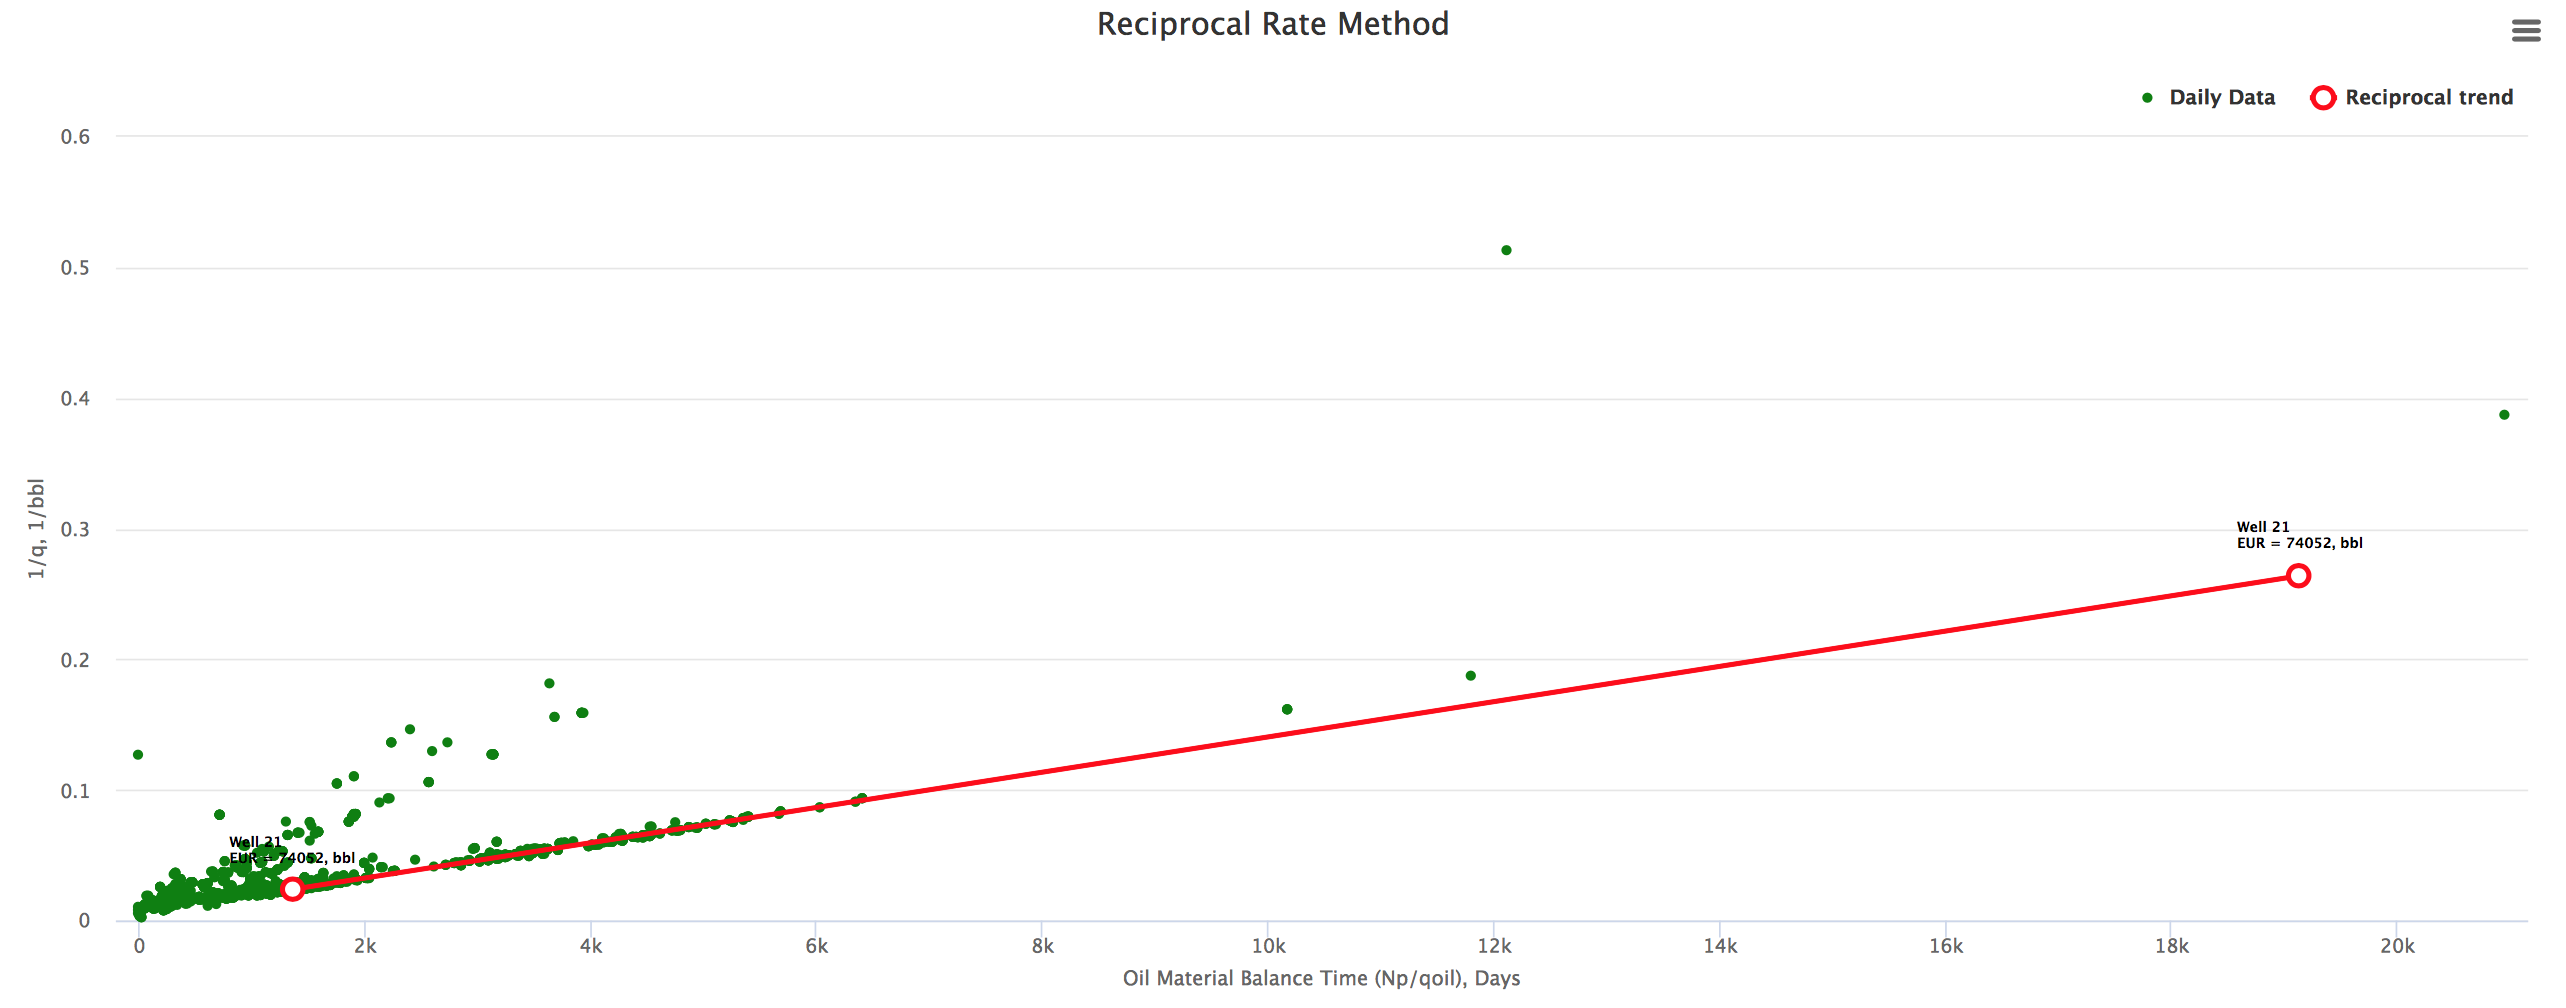
| 11:44, 29 May 2018 | Reciprocal Rate Method Example 2.png (file) |  |
69 KB | Reciprocal Rate Method Example 2: Well "21" refrac doubles the EUR as indicated by the slope change | 1 |
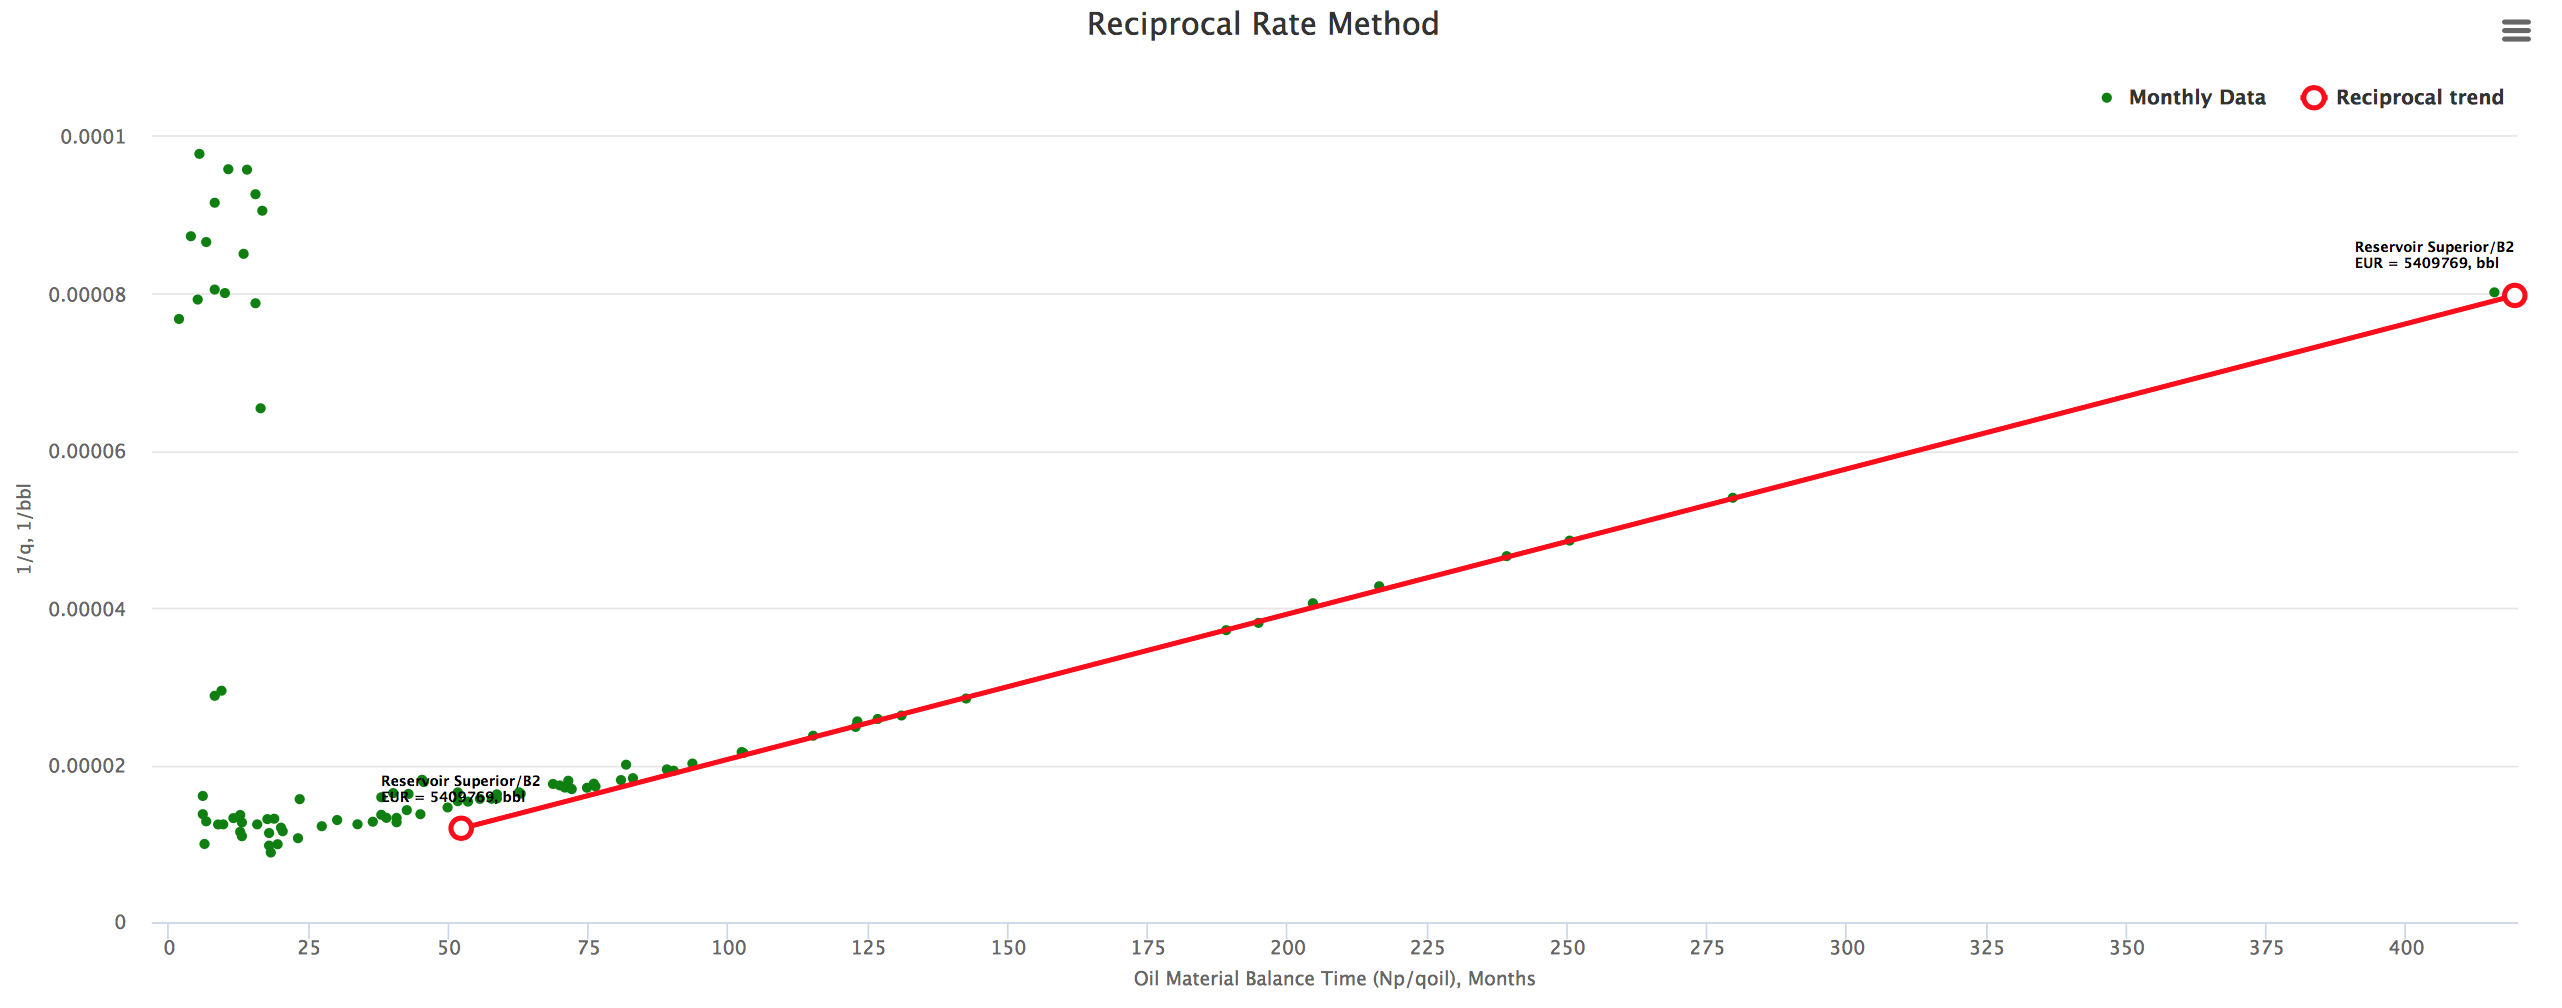
| 12:17, 29 May 2018 | Reciprocal Rate Method Example 4.png (file) |  |
79 KB | Reciprocal Rate Method Example 4 "B2" reservoir Reciprocal Rate Method plot showing the Reservoir EUR spread. | 1 |
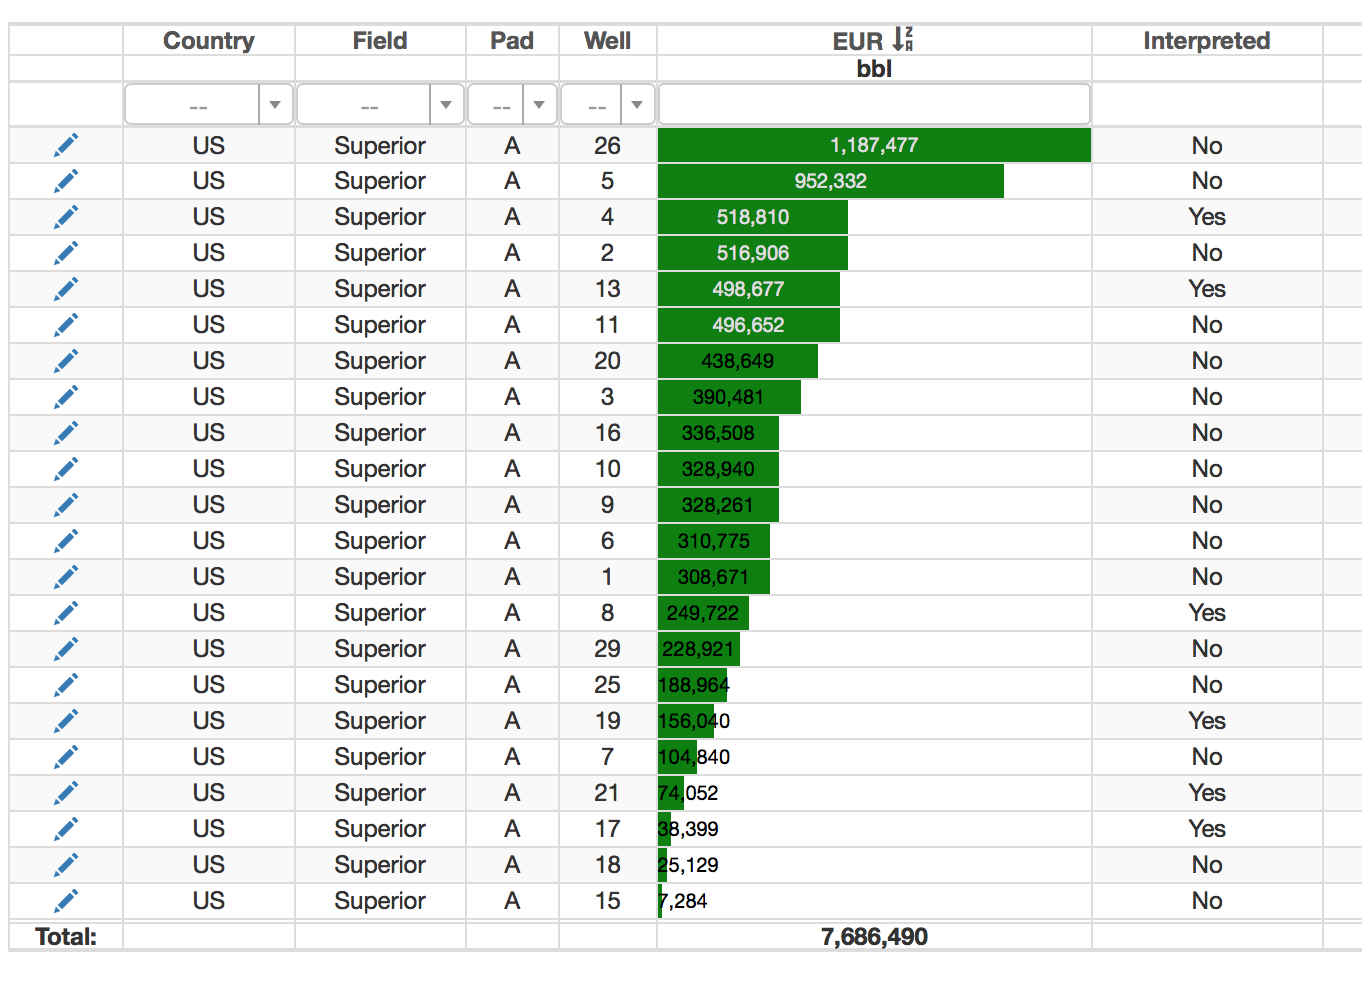
| 15:03, 29 May 2018 | Reciprocal Rate Method Example 3.png (file) |  |
121 KB | EUR results table for 22 wells. Automatically interpreted wells have "No" flag, manually interpreted "Yes" flag in the last column | 1 |
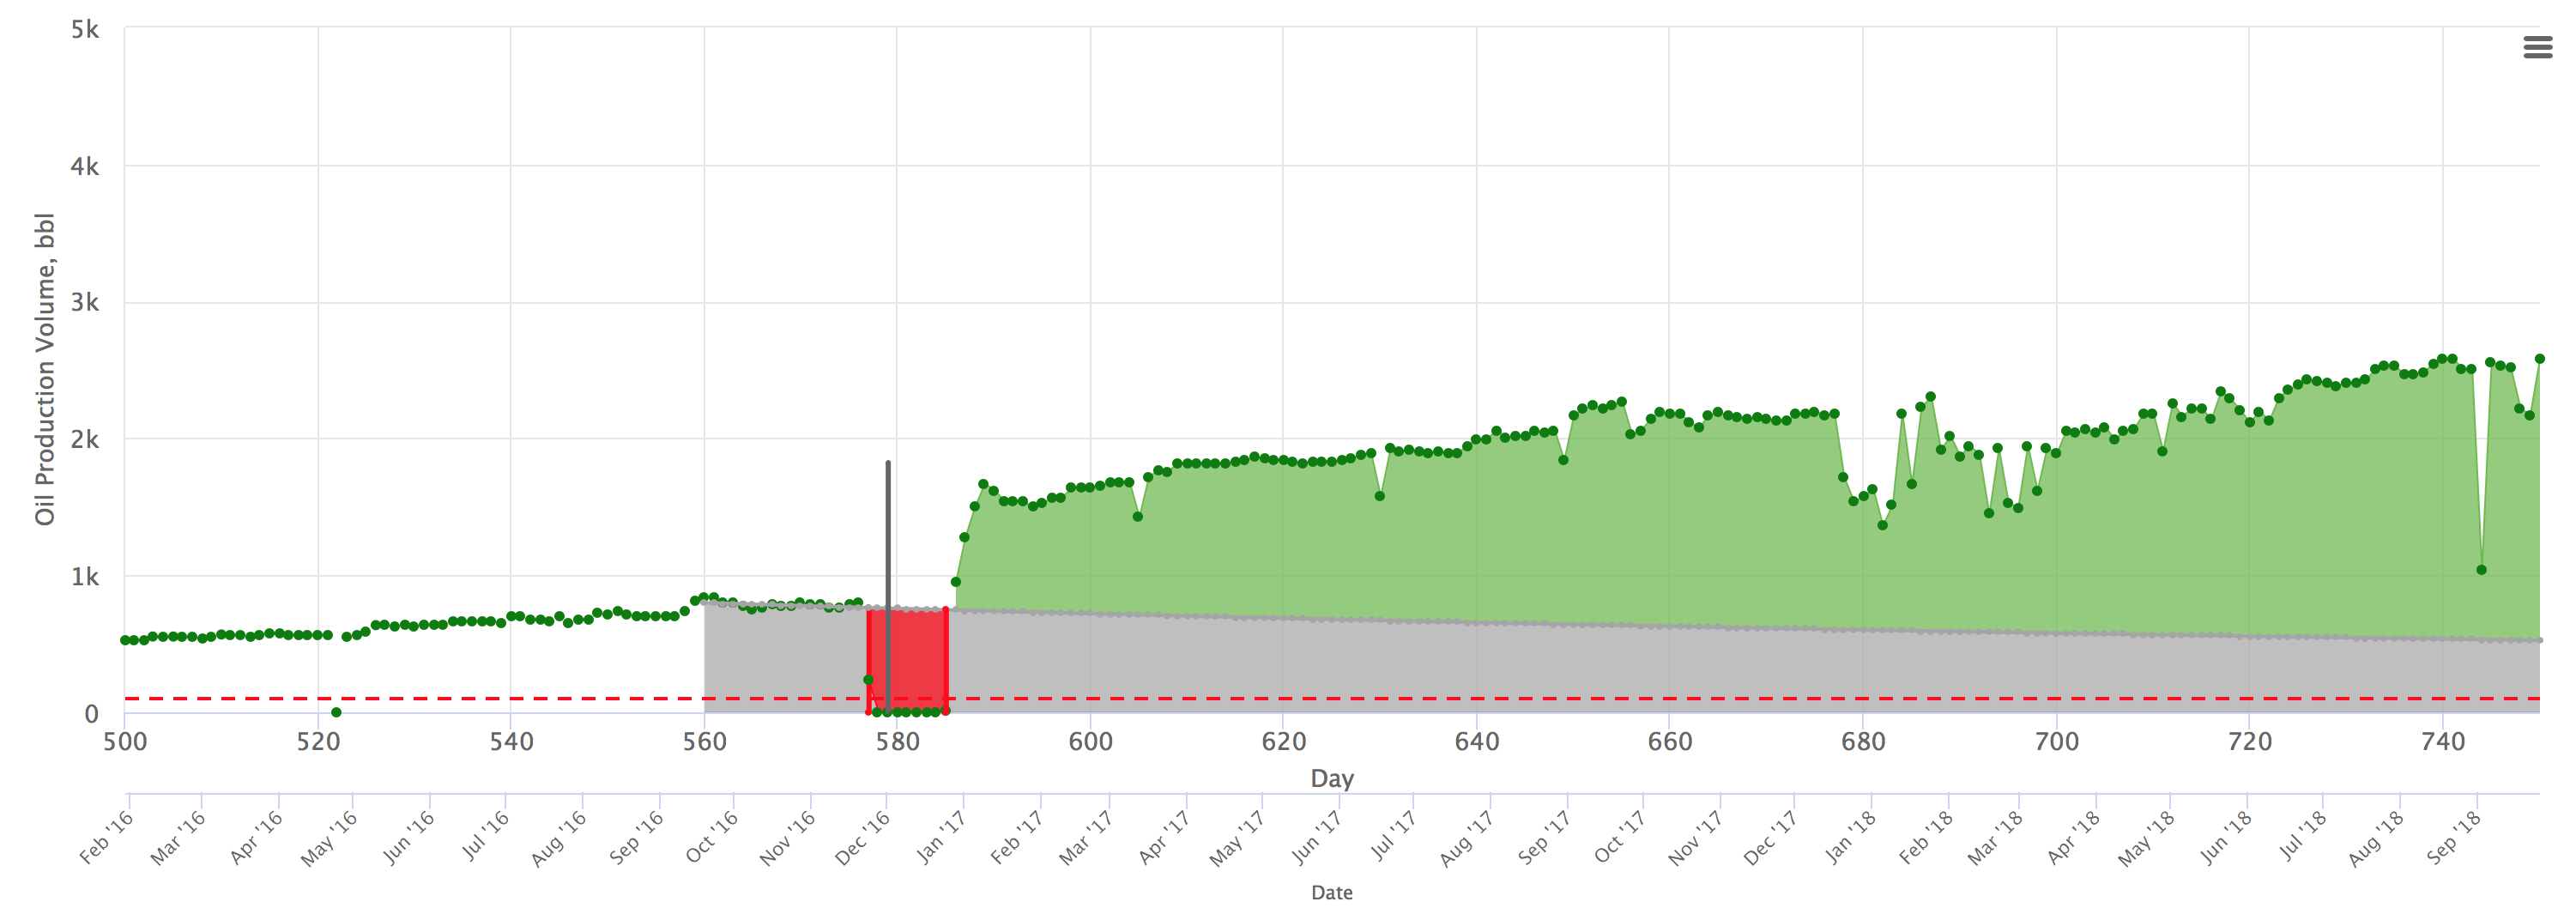
| 11:35, 10 July 2018 | Enhancement ESP.png (file) |  |
128 KB | Enhancement example: Converting the flowing well to the ESP (bbls) | 2 |
First page |
Previous page |
Next page |
Last page |