Decline Curve Analysis
From wiki.pengtools.com
Contents
Brief
Decline Curve Analysis (DCA) is an empirical method for rate decline analysis and rate forecasting published by Arps in 1945 [1].
DCA is applied for Wells and Reservoirs production forecasting.
E&P Portal has DCA available as one of it's engineering tools.
Math & Physics
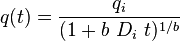
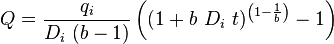
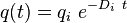
| Note [2] | Rate | Cumulative |
|---|---|---|
| Hyperbolic decline 0 < b < 1, b > 1 |
 |
 |
| Exponential decline b = 0 |
 |
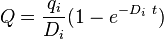 |
| Harmonic decline b = 1 |
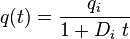 |
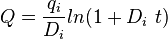 |
Discussion
If one has a need to convert decline factor Di to the actual annual decline in %:


Workflow
- Upload the data required
- Open the DCA tool here
- For a single well
- Select a well in a filter
- Input the initial rate,

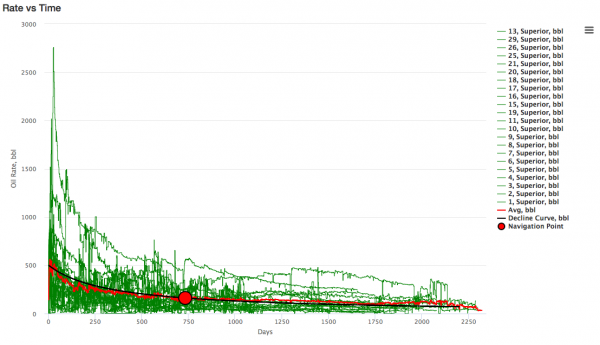
- Drag the Navigation Point to match the actual data
- Correct the model parameters manually if needed
- Check the difference in cumulative production of actual cure vs decline curve
- Check the Rate vs Cumulaive Plot in linear and log scale
- Save the decline curve model
- Move to the next well
- For a multiple wells
- Select the wells in the filter
- DCA tool will automatically normalize the wells data to zero time and then averages it
- Input the initial rate,
- Drag the Navigation Point to match the actual data
- Correct the model parameters manually if needed
- Check the difference in cumulative production of average cure vs decline curve
- Check the Rate vs Cumulaive Plot in linear and log scale
- Export the type curve if needed
Data required
Nomenclature
 = annual decline, %
 = decline curve parametr, dimensionless
 = decline factor per time t, dimensionless
- = initial rate, any rate units applies
 = rate at time t, any rate units applies
 = cumulatve rate at time t, any rate units applies
 = forecast time, days
References
- ↑ Arps, J. J. (1945). "Analysis of Decline Curves"
 . Transactions of the AIME. Society of Petroleum Engineers. 160 (01).
- ↑ "KAPPA Dynamic Data Analysis (DDA) book".